
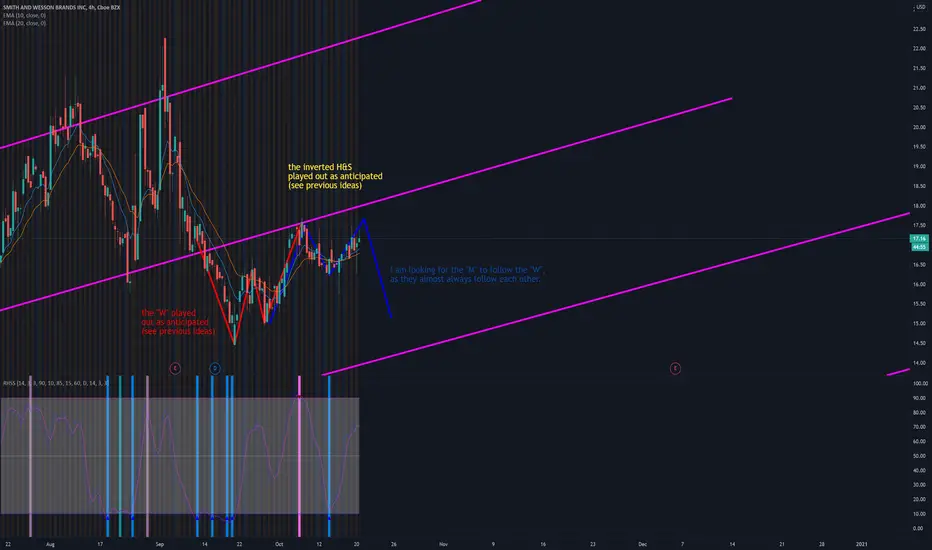
trading off the 10 & 20 EMAs, the daily is about to confirm the retest and signal an uptrend on the daily (green candle closing above the EMA cloud with the 10 over the 20) which could easily invalidate the idea published here: breaking down the right side of the blue "M".
If the "M" does play our as depicted, it will simply paint a larger "W" with an upside around $20, the resistance from our most recent major high.
If the "M" does play our as depicted, it will simply paint a larger "W" with an upside around $20, the resistance from our most recent major high.
トレード終了: 利益確定目標に到達
the M ran to its bottom against the lower side of the current channel.
免責事項
これらの情報および投稿は、TradingViewが提供または承認する金融、投資、取引、またはその他の種類の助言もしくは推奨であることを意図したものではなく、またこれらに該当するものでもありません。詳細は利用規約をご覧ください。
免責事項
これらの情報および投稿は、TradingViewが提供または承認する金融、投資、取引、またはその他の種類の助言もしくは推奨であることを意図したものではなく、またこれらに該当するものでもありません。詳細は利用規約をご覧ください。