
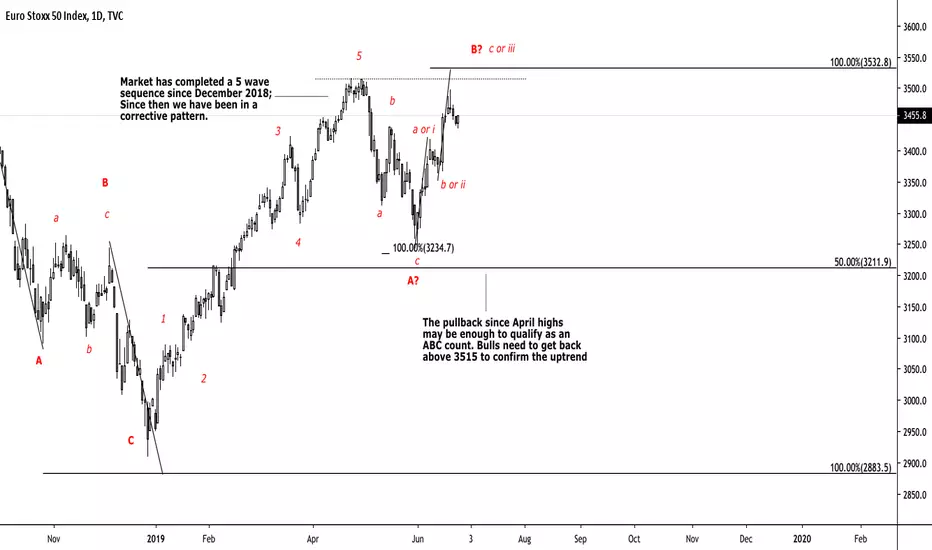
Our first Eurostoxx 'ridethepig' chart upload on Tradingview... Here we are witnessing the final fumes in this corrective process. The area we need to track is 3515 - 3533 which will include the ABC count from the lows in June. To put simply, anything below here will still be considered part of the corrective sequence (those with a background in waves will know this as an irregular expanding flat). This is therefore an important place to track for signs of a long-term meaningful top.
The failure to break higher than 3,533 is sending alarm bells that the move is lacking any signs of impulsive nature. Tracking very closely for a top to start forming in the 3515 - 3533 area. Whilst to the topside a break higher will open at least 3,640.
Best of luck all those tracking for the highs.
The failure to break higher than 3,533 is sending alarm bells that the move is lacking any signs of impulsive nature. Tracking very closely for a top to start forming in the 3515 - 3533 area. Whilst to the topside a break higher will open at least 3,640.
Best of luck all those tracking for the highs.

関連の投稿
免責事項
これらの情報および投稿は、TradingViewが提供または承認する金融、投資、取引、またはその他の種類の助言もしくは推奨であることを意図したものではなく、またこれらに該当するものでもありません。詳細は利用規約をご覧ください。
免責事項
これらの情報および投稿は、TradingViewが提供または承認する金融、投資、取引、またはその他の種類の助言もしくは推奨であることを意図したものではなく、またこれらに該当するものでもありません。詳細は利用規約をご覧ください。