ロング
SXP $89LONG-TERM TARGET! $20 SHORT-TERM
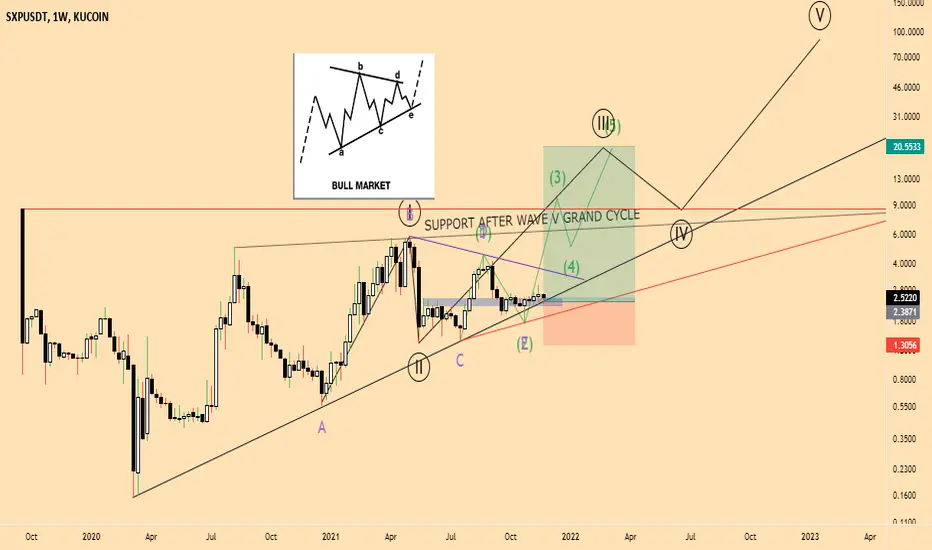
Please See original idea linked below
Apologies, left out a couple details.
This shows the ABCDE wave analysis which formed on the weekly and is the basis for a bullish pennant.
And we all love a good bullish pennant, not so often you see it on weekly charts.
All other explanations in the original idea linked below. Thank you
DISCLAIMER: Not Financial Advice
Apologies, left out a couple details.
This shows the ABCDE wave analysis which formed on the weekly and is the basis for a bullish pennant.
And we all love a good bullish pennant, not so often you see it on weekly charts.
All other explanations in the original idea linked below. Thank you
DISCLAIMER: Not Financial Advice
トレード終了: ストップロスに到達
Unfortunately our stop-loss has been triggered, not even our last resort trend line or the daily support zone could hold price action.
But not to worry, as long as we close the weekly candle above horizontal support, we can re-open our positions.
I'm still bullish for the time being.

関連の投稿
免責事項
これらの情報および投稿は、TradingViewが提供または承認する金融、投資、取引、またはその他の種類の助言もしくは推奨であることを意図したものではなく、またこれらに該当するものでもありません。詳細は利用規約をご覧ください。
免責事項
これらの情報および投稿は、TradingViewが提供または承認する金融、投資、取引、またはその他の種類の助言もしくは推奨であることを意図したものではなく、またこれらに該当するものでもありません。詳細は利用規約をご覧ください。