ショート
SYSBTC
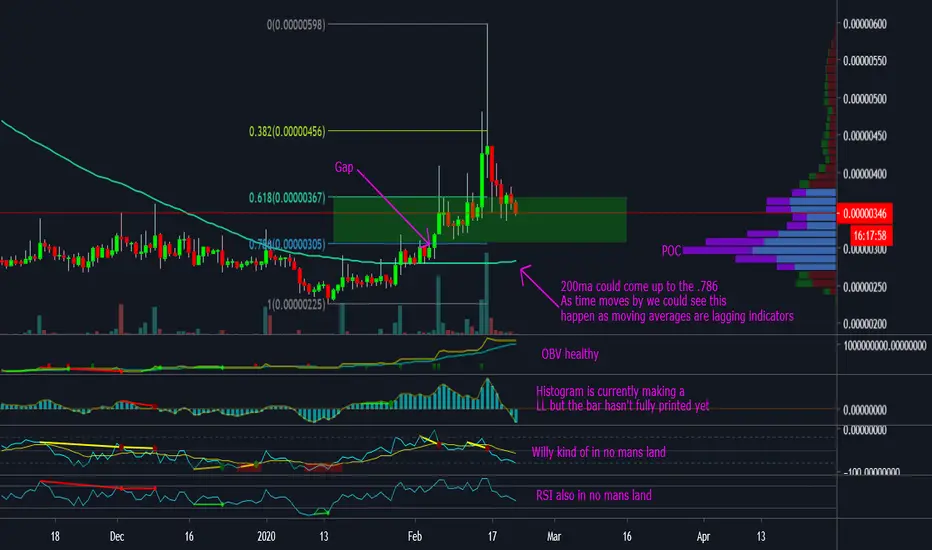
Looking at SYS on the daily
If you feel like you've missed out on the SYS this could be your second chance.
Looking to buy in the green zone, we hand a gap around 300 sats which also lines up with the .786 fib and the POC on VPVR
"Note" Histogram is still printing its last bar. What does this mean? If it prints lower the will more than likely continue down towards the 786 but if we print above we could see a continuation higher from here as the bulls are still in control of volume.
You could set some stink bids like I will be doing just in case someone decides to fat finger their puts.
If you like what I do, drop a comment, tell me what you think and don't forget to like and subscribing. Thanks :)
ノート
Confirmed and we move lover. Great buying opertunity 
免責事項
これらの情報および投稿は、TradingViewが提供または承認する金融、投資、取引、またはその他の種類の助言もしくは推奨であることを意図したものではなく、またこれらに該当するものでもありません。詳細は利用規約をご覧ください。
免責事項
これらの情報および投稿は、TradingViewが提供または承認する金融、投資、取引、またはその他の種類の助言もしくは推奨であることを意図したものではなく、またこれらに該当するものでもありません。詳細は利用規約をご覧ください。