
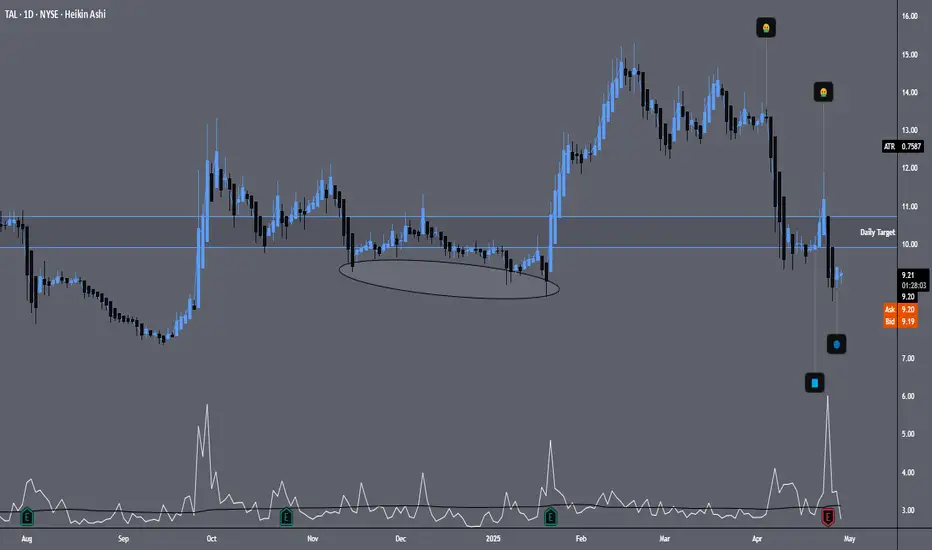
Looks like price is near a support zone dating back between November '24 - January '25. If we look at the two "throw up" emojis price shot down pretty sharp and price started to trade sideways (one on the left) then price retraced a bit before making a new local "potential" support zone if price settles here. Got a big bear volume spike on 4/24/25. Momentum is on a pause right now so I'm interested to see if we get bullish momentum coming in toward the target range located on the chart. If price goes lower, we will look for a second entry if opportunity presents itself.

免責事項
これらの情報および投稿は、TradingViewが提供または承認する金融、投資、取引、またはその他の種類の助言もしくは推奨であることを意図したものではなく、またこれらに該当するものでもありません。詳細は利用規約をご覧ください。
免責事項
これらの情報および投稿は、TradingViewが提供または承認する金融、投資、取引、またはその他の種類の助言もしくは推奨であることを意図したものではなく、またこれらに該当するものでもありません。詳細は利用規約をご覧ください。