
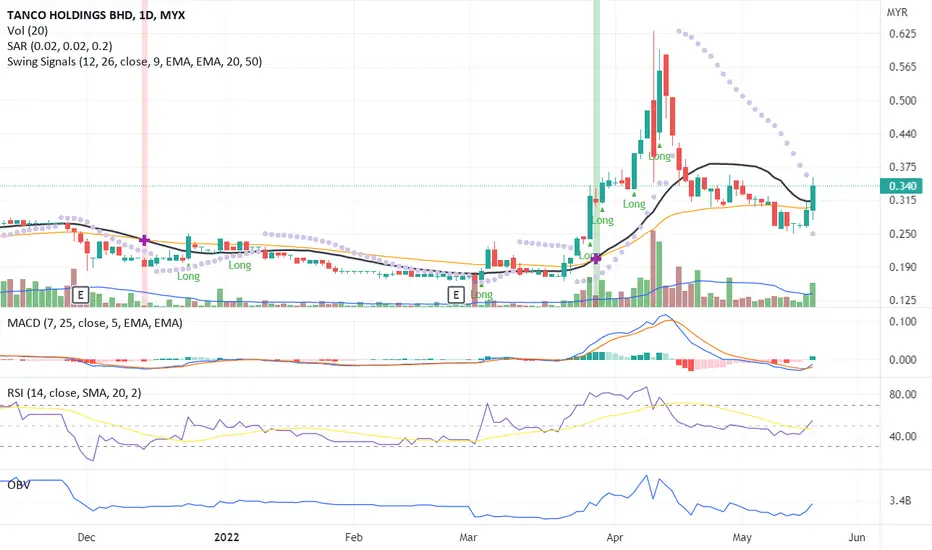
The candlestick indicates an uptrend pattern where the price closed above the MA20 line with volume crossing up the MA20 line.
The RSI, MACD, and OBV indicators indicate a divergence signal with a probability of an uptrend pattern.
Precaution for a price correction between 10% - 20% from the recent peak before the price continues with uptrend movement to the next price resistance.
Let's save TANCO in WL and watch out for significant price movement with volume to the next price resistance.
R 0.370
S 0.315
The RSI, MACD, and OBV indicators indicate a divergence signal with a probability of an uptrend pattern.
Precaution for a price correction between 10% - 20% from the recent peak before the price continues with uptrend movement to the next price resistance.
Let's save TANCO in WL and watch out for significant price movement with volume to the next price resistance.
R 0.370
S 0.315

免責事項
これらの情報および投稿は、TradingViewが提供または承認する金融、投資、取引、またはその他の種類の助言もしくは推奨であることを意図したものではなく、またこれらに該当するものでもありません。詳細は利用規約をご覧ください。
免責事項
これらの情報および投稿は、TradingViewが提供または承認する金融、投資、取引、またはその他の種類の助言もしくは推奨であることを意図したものではなく、またこれらに該当するものでもありません。詳細は利用規約をご覧ください。