
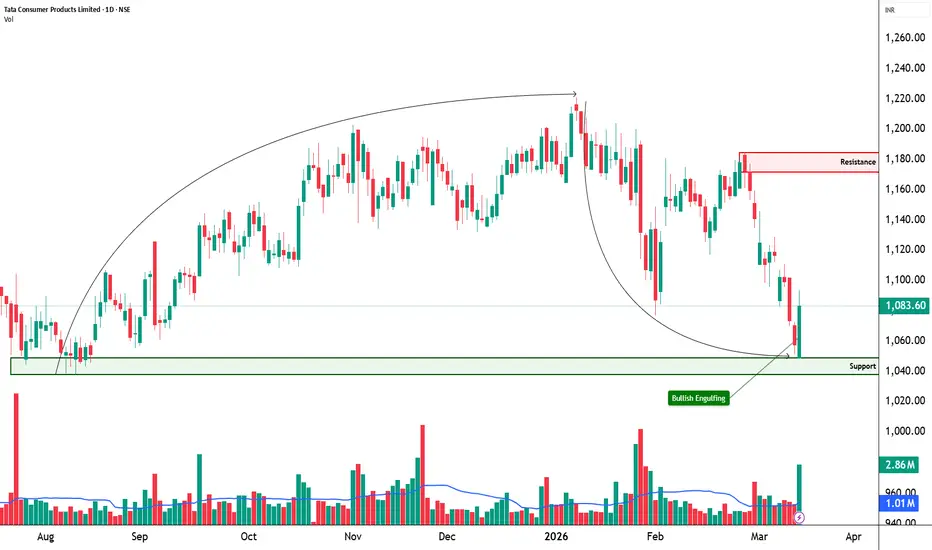
📊 TATACONSUM – STWP Equity Snapshot
Ticker: NSE: TATACONSUM
Sector: FMCG / Consumer Products
CMP: 1,083.60 ▲ (+2.44%)
Learning Rating: ⭐⭐⭐☆☆ (Reaction Near Structural Support)
Chart Pattern Observed: Pullback Toward Demand Zone After Distribution Phase
Candlestick Context: Moderate Reaction Candle Near Support
Tata Consumer Products has recently experienced a sustained corrective phase after earlier attempts to hold higher levels near the upper trading band. The structure over the past several weeks reflects weakening momentum, with price gradually slipping below intermediate support levels and forming a sequence of lower highs. This behaviour indicates that supply pressure has been dominating the short-term trend.
The most recent price action shows the stock approaching a historically reactive demand area around the 1,040–1,060 zone. This area has previously attracted buying participation, and the latest session shows a moderate reaction candle emerging from this region. While this indicates that buyers are attempting to stabilize the decline, the broader structure has not yet transitioned into a confirmed bullish recovery.
From a momentum standpoint, RSI is currently positioned around 37.9. This level suggests that the stock is approaching the lower end of the momentum spectrum without yet entering deeply oversold territory. Such positioning typically signals a potential stabilization phase, where selling pressure may begin to moderate and price may temporarily rotate within a consolidation band.
Participation during the recent move has been notably elevated, with relative volume close to 2.79 times the normal activity band. Elevated participation near support often indicates that market participants are actively engaging at these levels. However, continuation strength will depend on whether price can reclaim nearby resistance zones rather than merely reacting from support.
From a structural perspective, immediate supply remains positioned near the 1,102–1,121 zone, followed by a broader overhead resistance cluster near 1,148. These levels previously acted as reaction points where selling pressure emerged, and they remain critical barriers for any meaningful recovery attempt.
________________________________________
Volume Analysis
Current participation reflects significantly elevated trading activity, with relative volume close to 2.79 times the average band. This suggests heightened engagement from market participants as price approaches support. Elevated volume during corrective phases can sometimes indicate accumulation attempts, though confirmation will depend on whether follow-through buying appears near resistance levels.
________________________________________
Key Levels – Daily Timeframe
Primary support areas are located near 1,056, followed by deeper structural zones near 1,029 and 1,004. These levels have historically attracted demand and may continue to influence price behaviour if tested again.
On the upside, resistance zones are positioned around 1,102, followed by 1,121, and the broader supply band near 1,148. These levels represent areas where sellers previously regained control.
________________________________________
Structure Read – What Matters Now
The key observation is that price has reached a previously established support zone after a steady corrective phase. While a reaction is visible, the broader structure still reflects weak momentum and developing trend conditions.
If price manages to reclaim and sustain above the 1,102–1,121 resistance band, the probability of a short-term recovery increases. However, failure to hold the 1,056 support area could lead to renewed downside exploration toward deeper support levels.
At present, the structure appears to be transitioning toward a range stabilization phase, rather than an immediate directional breakout.
________________________________________
Price Reference Framework – Educational View
From an intraday perspective, the observation zone lies around 1,093, with risk invalidation below 1,046. Upside reaction zones are positioned near 1,141 and 1,188, where price may encounter supply pressure.
From a swing perspective over the next two to five sessions, the observation zone remains near 1,093, while structural invalidation lies below 980. If recovery momentum strengthens and price sustains above intermediate resistance, higher reference zones extend toward 1,320 and 1,491.
These levels serve purely as educational reference points for studying price behaviour within the current structure.
________________________________________
STWP Option Chain Analysis
From the current options activity, an important support area appears near 1,050, while resistance positioning is concentrated around 1,090. Liquidity appears densest near the 1,080 strike, which may act as a short-term price magnet as participants adjust positions.
Call-side positioning is building around 1,090, while put-side liquidity remains visible near 1,050. Another level worth monitoring is 1,120, where price may encounter hedging-driven reactions.
The visible positioning band currently spans roughly 1,050 to 1,090, creating an approximate range width of about 40 points. Based on this structure, the estimated intraday movement expectation is roughly ±16 points from the ATM level.
This places the approximate upper activity zone near 1,096, while the lower activity zone appears near 1,064.
Options pressure currently reflects Call Pressure near 42% and Put Pressure near 58%, indicating slightly stronger support-side positioning. Current positioning does not indicate the presence of a strong dealer trap structure.
The options build-up signal currently reflects Long Build-Up conditions, suggesting incremental positioning on the buy side.
Key liquidity strikes currently visible include:
Best CE Liquidity Strike: 1,090
Best PE Liquidity Strike: 1,070
A potential liquidity vacuum is visible near 1,040, where price could move more rapidly if selling pressure increases.
Overall, the current options structure suggests that price may continue rotating between 1,050 and 1,090, with 1,080 acting as a short-term liquidity magnet while participants continue adjusting their positions.
________________________________________
STWP View
Momentum is currently moderate while the broader trend remains range-bound and developing. Risk remains elevated due to the preceding corrective phase, although elevated volume near support suggests that market participants are actively engaging at current levels. The session registered a gain of approximately 2.44 percent.
________________________________________
Final Outlook
Momentum: Moderate
Trend: Range
Risk: High
Volume: High
________________________________________
📘 Learning Note
When price approaches a historically reactive support zone after a sustained decline, the first reaction often represents stabilization rather than an immediate trend reversal. Traders should observe whether price can reclaim nearby supply zones, as structure and acceptance ultimately determine whether a bounce evolves into a sustained recovery.
________________________________________
⚠️ Disclaimer
This post is intended solely for educational and informational purposes. It does not constitute investment advice, a recommendation, or a solicitation to buy or sell any security. Market investments are subject to risk. Please consult a SEBI-registered financial advisor before making any investment decisions. STWP is not responsible for actions taken based on this analysis.
Ticker: NSE: TATACONSUM
Sector: FMCG / Consumer Products
CMP: 1,083.60 ▲ (+2.44%)
Learning Rating: ⭐⭐⭐☆☆ (Reaction Near Structural Support)
Chart Pattern Observed: Pullback Toward Demand Zone After Distribution Phase
Candlestick Context: Moderate Reaction Candle Near Support
Tata Consumer Products has recently experienced a sustained corrective phase after earlier attempts to hold higher levels near the upper trading band. The structure over the past several weeks reflects weakening momentum, with price gradually slipping below intermediate support levels and forming a sequence of lower highs. This behaviour indicates that supply pressure has been dominating the short-term trend.
The most recent price action shows the stock approaching a historically reactive demand area around the 1,040–1,060 zone. This area has previously attracted buying participation, and the latest session shows a moderate reaction candle emerging from this region. While this indicates that buyers are attempting to stabilize the decline, the broader structure has not yet transitioned into a confirmed bullish recovery.
From a momentum standpoint, RSI is currently positioned around 37.9. This level suggests that the stock is approaching the lower end of the momentum spectrum without yet entering deeply oversold territory. Such positioning typically signals a potential stabilization phase, where selling pressure may begin to moderate and price may temporarily rotate within a consolidation band.
Participation during the recent move has been notably elevated, with relative volume close to 2.79 times the normal activity band. Elevated participation near support often indicates that market participants are actively engaging at these levels. However, continuation strength will depend on whether price can reclaim nearby resistance zones rather than merely reacting from support.
From a structural perspective, immediate supply remains positioned near the 1,102–1,121 zone, followed by a broader overhead resistance cluster near 1,148. These levels previously acted as reaction points where selling pressure emerged, and they remain critical barriers for any meaningful recovery attempt.
________________________________________
Volume Analysis
Current participation reflects significantly elevated trading activity, with relative volume close to 2.79 times the average band. This suggests heightened engagement from market participants as price approaches support. Elevated volume during corrective phases can sometimes indicate accumulation attempts, though confirmation will depend on whether follow-through buying appears near resistance levels.
________________________________________
Key Levels – Daily Timeframe
Primary support areas are located near 1,056, followed by deeper structural zones near 1,029 and 1,004. These levels have historically attracted demand and may continue to influence price behaviour if tested again.
On the upside, resistance zones are positioned around 1,102, followed by 1,121, and the broader supply band near 1,148. These levels represent areas where sellers previously regained control.
________________________________________
Structure Read – What Matters Now
The key observation is that price has reached a previously established support zone after a steady corrective phase. While a reaction is visible, the broader structure still reflects weak momentum and developing trend conditions.
If price manages to reclaim and sustain above the 1,102–1,121 resistance band, the probability of a short-term recovery increases. However, failure to hold the 1,056 support area could lead to renewed downside exploration toward deeper support levels.
At present, the structure appears to be transitioning toward a range stabilization phase, rather than an immediate directional breakout.
________________________________________
Price Reference Framework – Educational View
From an intraday perspective, the observation zone lies around 1,093, with risk invalidation below 1,046. Upside reaction zones are positioned near 1,141 and 1,188, where price may encounter supply pressure.
From a swing perspective over the next two to five sessions, the observation zone remains near 1,093, while structural invalidation lies below 980. If recovery momentum strengthens and price sustains above intermediate resistance, higher reference zones extend toward 1,320 and 1,491.
These levels serve purely as educational reference points for studying price behaviour within the current structure.
________________________________________
STWP Option Chain Analysis
From the current options activity, an important support area appears near 1,050, while resistance positioning is concentrated around 1,090. Liquidity appears densest near the 1,080 strike, which may act as a short-term price magnet as participants adjust positions.
Call-side positioning is building around 1,090, while put-side liquidity remains visible near 1,050. Another level worth monitoring is 1,120, where price may encounter hedging-driven reactions.
The visible positioning band currently spans roughly 1,050 to 1,090, creating an approximate range width of about 40 points. Based on this structure, the estimated intraday movement expectation is roughly ±16 points from the ATM level.
This places the approximate upper activity zone near 1,096, while the lower activity zone appears near 1,064.
Options pressure currently reflects Call Pressure near 42% and Put Pressure near 58%, indicating slightly stronger support-side positioning. Current positioning does not indicate the presence of a strong dealer trap structure.
The options build-up signal currently reflects Long Build-Up conditions, suggesting incremental positioning on the buy side.
Key liquidity strikes currently visible include:
Best CE Liquidity Strike: 1,090
Best PE Liquidity Strike: 1,070
A potential liquidity vacuum is visible near 1,040, where price could move more rapidly if selling pressure increases.
Overall, the current options structure suggests that price may continue rotating between 1,050 and 1,090, with 1,080 acting as a short-term liquidity magnet while participants continue adjusting their positions.
________________________________________
STWP View
Momentum is currently moderate while the broader trend remains range-bound and developing. Risk remains elevated due to the preceding corrective phase, although elevated volume near support suggests that market participants are actively engaging at current levels. The session registered a gain of approximately 2.44 percent.
________________________________________
Final Outlook
Momentum: Moderate
Trend: Range
Risk: High
Volume: High
________________________________________
📘 Learning Note
When price approaches a historically reactive support zone after a sustained decline, the first reaction often represents stabilization rather than an immediate trend reversal. Traders should observe whether price can reclaim nearby supply zones, as structure and acceptance ultimately determine whether a bounce evolves into a sustained recovery.
________________________________________
⚠️ Disclaimer
This post is intended solely for educational and informational purposes. It does not constitute investment advice, a recommendation, or a solicitation to buy or sell any security. Market investments are subject to risk. Please consult a SEBI-registered financial advisor before making any investment decisions. STWP is not responsible for actions taken based on this analysis.

STWP | Mentor & Demand-Supply Specialist |
Empowering traders through structured learning |
simpletradewithpatience.com
Community: chat.whatsapp.com/BEYz0tkqP0fJPBCWf59uel
wa.me/message/6IOPHGOXMGZ4N1
Educational Only
Empowering traders through structured learning |
simpletradewithpatience.com
Community: chat.whatsapp.com/BEYz0tkqP0fJPBCWf59uel
wa.me/message/6IOPHGOXMGZ4N1
Educational Only
免責事項
これらの情報および投稿は、TradingViewが提供または承認する金融、投資、取引、またはその他の種類の助言もしくは推奨であることを意図したものではなく、またこれらに該当するものでもありません。詳細は利用規約をご覧ください。
STWP | Mentor & Demand-Supply Specialist |
Empowering traders through structured learning |
simpletradewithpatience.com
Community: chat.whatsapp.com/BEYz0tkqP0fJPBCWf59uel
wa.me/message/6IOPHGOXMGZ4N1
Educational Only
Empowering traders through structured learning |
simpletradewithpatience.com
Community: chat.whatsapp.com/BEYz0tkqP0fJPBCWf59uel
wa.me/message/6IOPHGOXMGZ4N1
Educational Only
免責事項
これらの情報および投稿は、TradingViewが提供または承認する金融、投資、取引、またはその他の種類の助言もしくは推奨であることを意図したものではなく、またこれらに該当するものでもありません。詳細は利用規約をご覧ください。