
Long-Term Structure
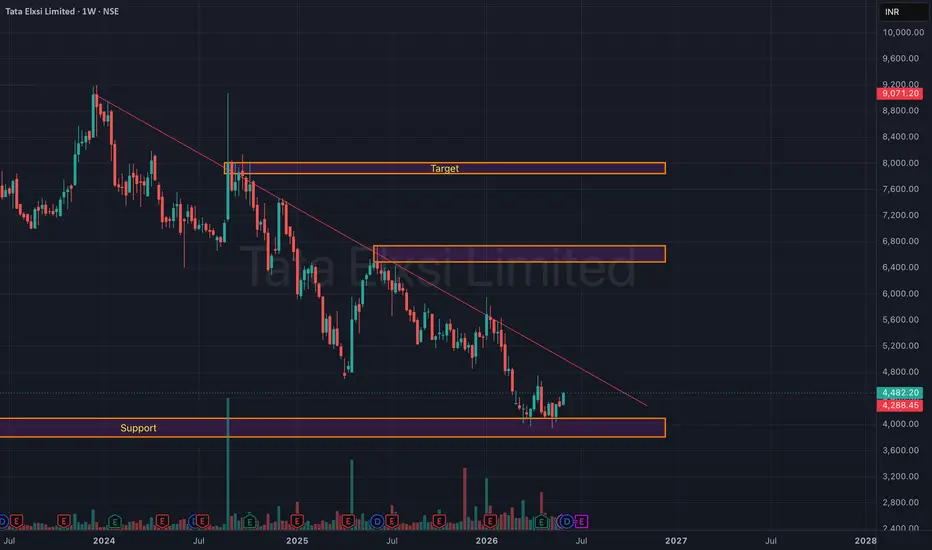
Since its peak near ₹9,000, the stock has been in a well-defined downtrend characterized by:
🔻 Lower Highs
🔻 Lower Lows
🔻 Persistent selling pressure
The red trendline on the chart has acted as dynamic resistance throughout the decline.
Major Demand Zone: ₹3,800 – ₹4,100
This zone has emerged as a strong support area where buyers have repeatedly stepped in.
Key observations:
✅ Multiple rejections from lower levels
✅ Formation of a base after capitulation
✅ Increased buying interest near support
✅ Risk-reward improving significantly
As long as price sustains above this zone, the possibility of a medium-term trend reversal remains alive.
Upside Targets
If the breakout sustains:
Target 1: ₹5,500 – ₹5,800
Target 2: ₹6,500 – ₹7,000
Major Target Zone: ₹7,800 – ₹8,000
This target area corresponds to the previous major supply zone highlighted on the chart.
Tata Elxsi is transitioning from a prolonged downtrend into a potential accumulation phase. The stock is positioned near a critical inflection point where a breakout above the falling trendline could trigger a meaningful trend reversal.
Since its peak near ₹9,000, the stock has been in a well-defined downtrend characterized by:
🔻 Lower Highs
🔻 Lower Lows
🔻 Persistent selling pressure
The red trendline on the chart has acted as dynamic resistance throughout the decline.
Major Demand Zone: ₹3,800 – ₹4,100
This zone has emerged as a strong support area where buyers have repeatedly stepped in.
Key observations:
✅ Multiple rejections from lower levels
✅ Formation of a base after capitulation
✅ Increased buying interest near support
✅ Risk-reward improving significantly
As long as price sustains above this zone, the possibility of a medium-term trend reversal remains alive.
Upside Targets
If the breakout sustains:
Target 1: ₹5,500 – ₹5,800
Target 2: ₹6,500 – ₹7,000
Major Target Zone: ₹7,800 – ₹8,000
This target area corresponds to the previous major supply zone highlighted on the chart.
Tata Elxsi is transitioning from a prolonged downtrend into a potential accumulation phase. The stock is positioned near a critical inflection point where a breakout above the falling trendline could trigger a meaningful trend reversal.

免責事項
これらの情報および投稿は、TradingViewが提供または承認する金融、投資、取引、またはその他の種類の助言もしくは推奨であることを意図したものではなく、またこれらに該当するものでもありません。詳細は利用規約をご覧ください。
免責事項
これらの情報および投稿は、TradingViewが提供または承認する金融、投資、取引、またはその他の種類の助言もしくは推奨であることを意図したものではなく、またこれらに該当するものでもありません。詳細は利用規約をご覧ください。