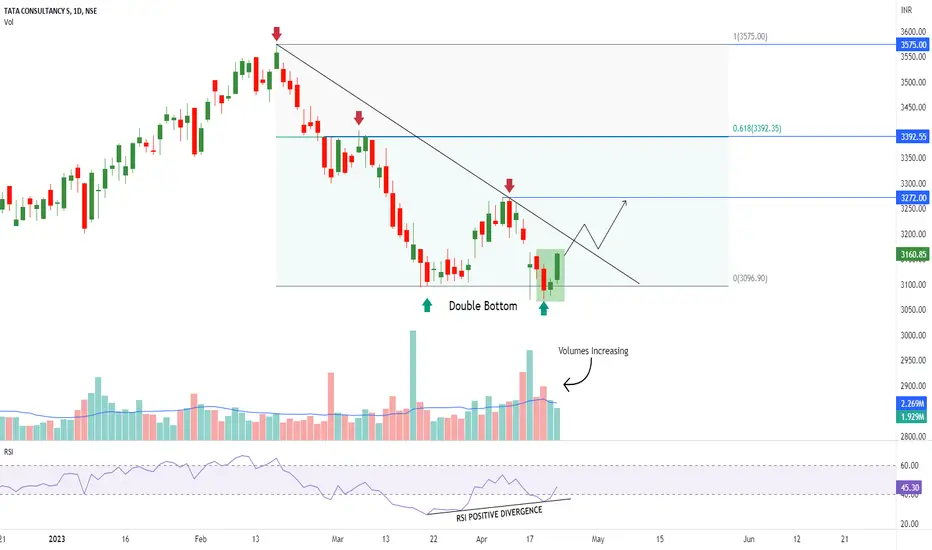
 TCS is trading at its important weekly support level.
On Daily chart it has formed kind of Morning Star Candlestick Pattern & Double Bottom Price Action Pattern.
Positive RSI Divergence is also seen.
Volume is still rising, which suggests that there is more upside potential for the stock.
- Support- 3100
Resistance- 3275/3400/3575

免責事項
これらの情報および投稿は、TradingViewが提供または承認する金融、投資、取引、またはその他の種類の助言もしくは推奨であることを意図したものではなく、またこれらに該当するものでもありません。詳細は利用規約をご覧ください。
免責事項
これらの情報および投稿は、TradingViewが提供または承認する金融、投資、取引、またはその他の種類の助言もしくは推奨であることを意図したものではなく、またこれらに該当するものでもありません。詳細は利用規約をご覧ください。