TCT/BTC (Pullback To Key Area?)
TCT/BTC
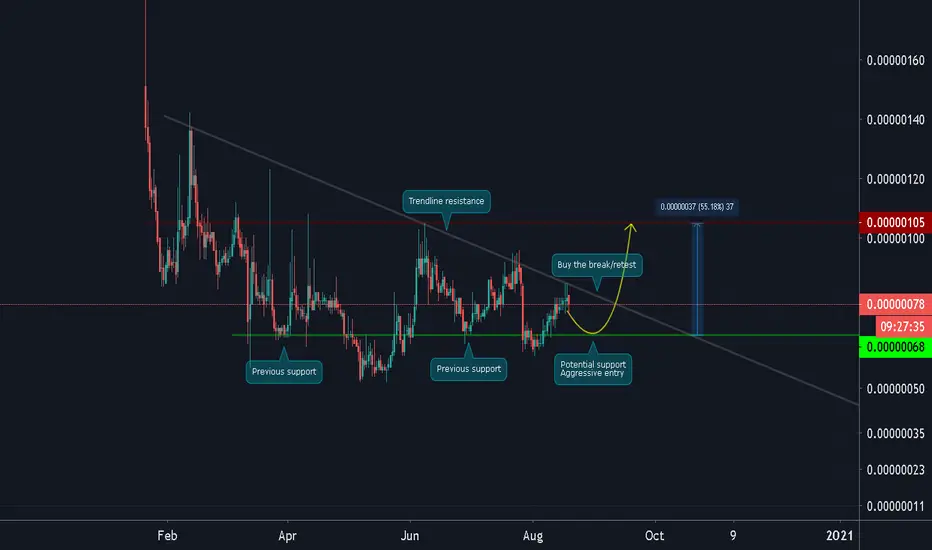
-The price is unable to break the trendline resistance
-At around 85 sat area or higher
-If TCT will pullback at a key area
-The level needs to be watching is around 68 sat
-This is a confluence of two previous support
-If that level will hold and bounce up
-Chances of breaking the trendline resistance will increase
-As we all know, the more time the area is tested
-The more likely it will break in the future
-My upside potential target is up to 105 sat or higher
-Bearish side, a daily close below 65 sat will lead to longer accumulation
-The price is unable to break the trendline resistance
-At around 85 sat area or higher
-If TCT will pullback at a key area
-The level needs to be watching is around 68 sat
-This is a confluence of two previous support
-If that level will hold and bounce up
-Chances of breaking the trendline resistance will increase
-As we all know, the more time the area is tested
-The more likely it will break in the future
-My upside potential target is up to 105 sat or higher
-Bearish side, a daily close below 65 sat will lead to longer accumulation

免責事項
これらの情報および投稿は、TradingViewが提供または承認する金融、投資、取引、またはその他の種類の助言もしくは推奨であることを意図したものではなく、またこれらに該当するものでもありません。詳細は利用規約をご覧ください。
免責事項
これらの情報および投稿は、TradingViewが提供または承認する金融、投資、取引、またはその他の種類の助言もしくは推奨であることを意図したものではなく、またこれらに該当するものでもありません。詳細は利用規約をご覧ください。