
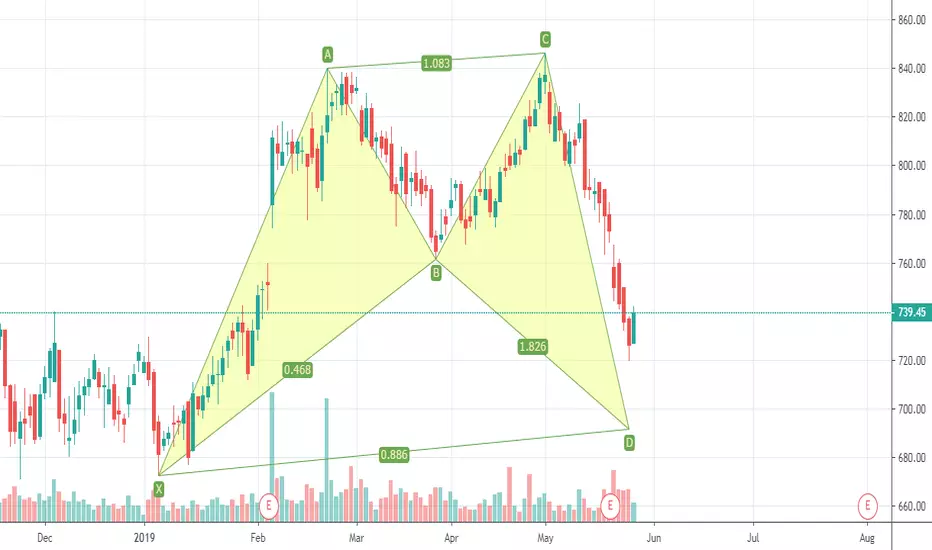
Bullish Shark pattern on Daily Chart of TECHM. BUY 689-692.5, SL 669.9, Target(s) 705, 712. It needs to break the support of 720 to come down to our price. Pattern is forming on Daily TF so levels are according to Daily TF only.
I starting learning Harmonics some days ago and just observing currently, how the price action works here and thereby trying to refine on my Target(s), SL and entry levels.
I starting learning Harmonics some days ago and just observing currently, how the price action works here and thereby trying to refine on my Target(s), SL and entry levels.
トレード終了: 利益確定目標に到達
After 1 month of waiting.
免責事項
これらの情報および投稿は、TradingViewが提供または承認する金融、投資、取引、またはその他の種類の助言もしくは推奨であることを意図したものではなく、またこれらに該当するものでもありません。詳細は利用規約をご覧ください。
免責事項
これらの情報および投稿は、TradingViewが提供または承認する金融、投資、取引、またはその他の種類の助言もしくは推奨であることを意図したものではなく、またこれらに該当するものでもありません。詳細は利用規約をご覧ください。