
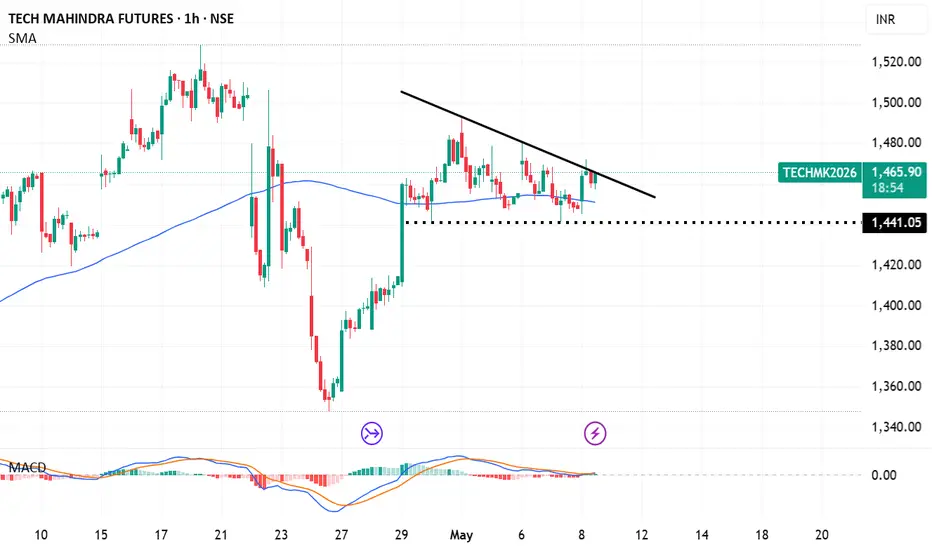
A descending triangle is characterized by a flat support line and a descending resistance line. For a Buy setup, you are looking for a bullish breakout above the downward-sloping resistance line, often triggered by a trend reversal or a "failed" bearish pattern.
Entry Point: Buy above the upper descending resistance line (currently near ₹1,465) once a candle closes above it on the hourly timeframe.
Stop-loss: ₹1,430 (Placed below the flat support base of the triangle to protect against a breakdown).
Target: ₹1,530 (This aligns with major psychological resistance and recent swing highs).
Entry Point: Buy above the upper descending resistance line (currently near ₹1,465) once a candle closes above it on the hourly timeframe.
Stop-loss: ₹1,430 (Placed below the flat support base of the triangle to protect against a breakdown).
Target: ₹1,530 (This aligns with major psychological resistance and recent swing highs).

免責事項
これらの情報および投稿は、TradingViewが提供または承認する金融、投資、取引、またはその他の種類の助言もしくは推奨であることを意図したものではなく、またこれらに該当するものでもありません。詳細は利用規約をご覧ください。
免責事項
これらの情報および投稿は、TradingViewが提供または承認する金融、投資、取引、またはその他の種類の助言もしくは推奨であることを意図したものではなく、またこれらに該当するものでもありません。詳細は利用規約をご覧ください。