ショート
Distribution Phase D
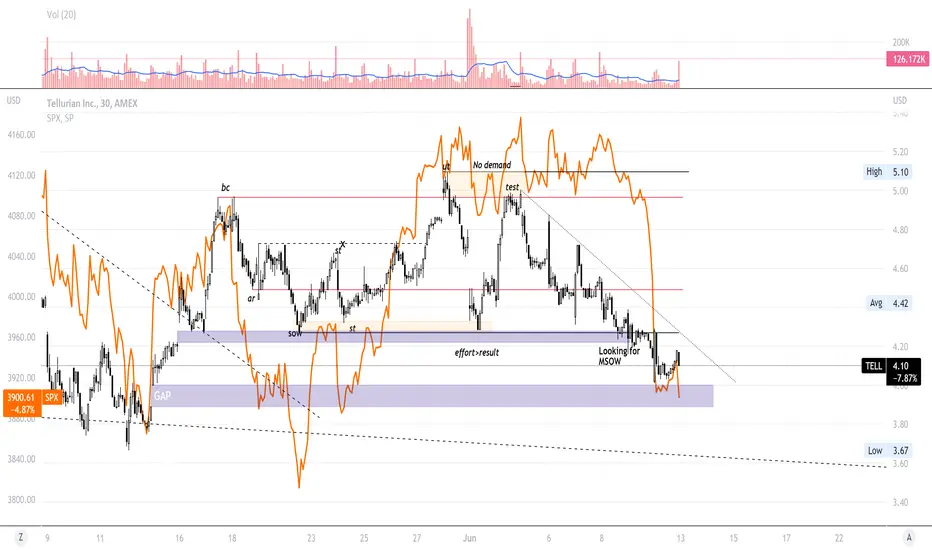
It is likely to see a continuation Down, After many tests and signs of weakness within the range. After phase c was created it is evident that the trendline created is part of Phase d. around phase C was evident of an Extreme SOW and confirmation of the previous sow after breaking the AR level.
ノート
as you may see now, there is a confirmed sign of weakness with continual lower lows and lower highs. Supply is dominant
免責事項
これらの情報および投稿は、TradingViewが提供または承認する金融、投資、取引、またはその他の種類の助言もしくは推奨であることを意図したものではなく、またこれらに該当するものでもありません。詳細は利用規約をご覧ください。
免責事項
これらの情報および投稿は、TradingViewが提供または承認する金融、投資、取引、またはその他の種類の助言もしくは推奨であることを意図したものではなく、またこれらに該当するものでもありません。詳細は利用規約をご覧ください。