
Hello everyone, I’m Cryptorphic.
For the past seven years, I’ve been sharing insightful charts and analysis.
Follow me for:
~ Unbiased analyses on trending altcoins.
~ Identifying altcoins with 10x-50x potential.
~ Futures trade setups.
~ Daily updates on Bitcoin and Ethereum.
~ High time frame (HTF) market bottom and top calls.
~ Short-term market movements.
~ Charts supported by critical fundamentals.
Now, let’s dive into this chart analysis:
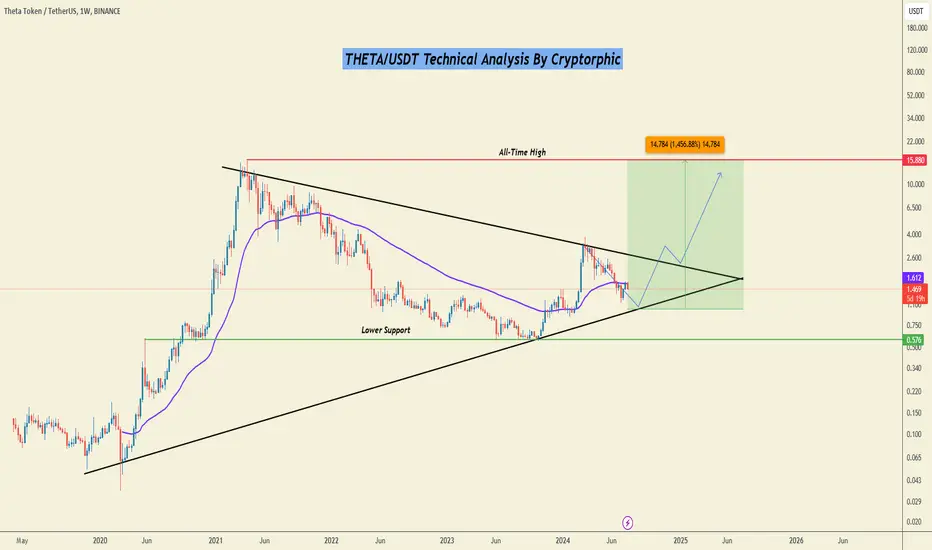
The weekly chart for THETA/USDT showcases the continuation of a downtrend, with a significant support level at $1 and a lower support at $0.576.
The current price is facing the 50 EMA resistance, and the action indicates that THETA will test the support trendline and then rebound.
THETA must break above the resistance trendline at $2.5 to continue a higher rally targeting the all-time high level.
Key Observations:
- Primary Support: $1.
- Lower Support: $0.576.
- Primary Resistance: 50 EMA ($1.612).
- Higher Resistance: $2.5.
DYOR, NFA.
Please hit the like button to support my content and share your thoughts in the comment section. Feel free to request any chart analysis you’d like to see!
Thank you!
#PEACE

Daily Signals:- telegram.me/thecryptorphic
My Fav BITUNIX: bitunix.com/register?vipCode=Cryptorphic
Weex $2000: bit.ly/Weex2026
ELITES: bit.ly/Join_elite
My Fav BITUNIX: bitunix.com/register?vipCode=Cryptorphic
Weex $2000: bit.ly/Weex2026
ELITES: bit.ly/Join_elite
関連の投稿
免責事項
これらの情報および投稿は、TradingViewが提供または承認する金融、投資、取引、またはその他の種類の助言もしくは推奨であることを意図したものではなく、またこれらに該当するものでもありません。詳細は利用規約をご覧ください。