
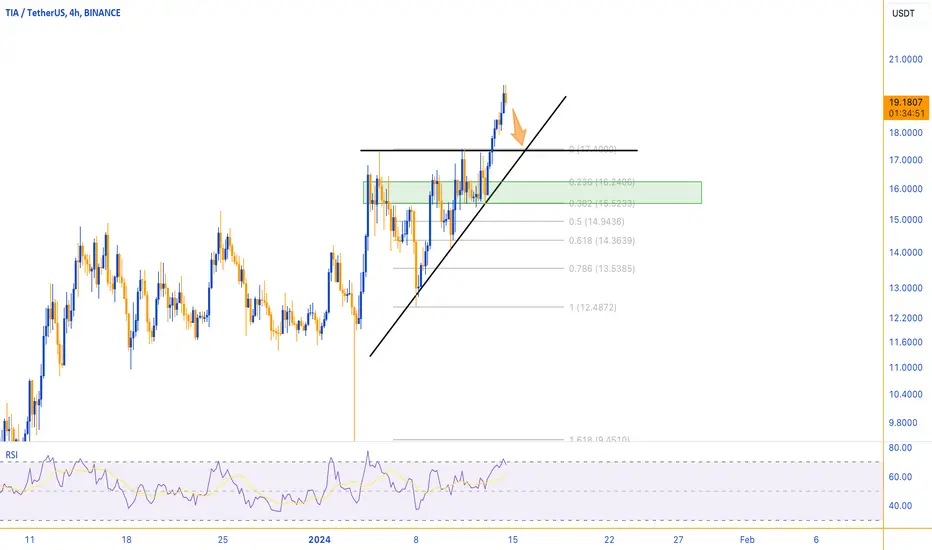
• As observed, there has been a recent development on the 4-hour TIA chart, indicating the formation of a triangle.
• In the last few candles, a breakout has occurred through the triangle's upper boundary.
• It is important to note, however, that the consolidating candles are not yet formed.
• Therefore, it is reasonable to expect a pullback in this vicinity.
• Following the pullback, a continuation of the upward price movement is anticipated.
(All analyses will be updated)
This analysis is informational, not financial advice.
• In the last few candles, a breakout has occurred through the triangle's upper boundary.
• It is important to note, however, that the consolidating candles are not yet formed.
• Therefore, it is reasonable to expect a pullback in this vicinity.
• Following the pullback, a continuation of the upward price movement is anticipated.
(All analyses will be updated)
This analysis is informational, not financial advice.

Join the free Telegram channel
💎 Telegram Channel: t.me/MonoCoin_Public
🔔 Bot: t.me/MonoCoinSignal_Bot?start=starter_tv
🌐 Website: MonoCoin.net
⭐️ 5-Star TrustPilot: trustpilot.com/review/monocoin.net
💎 Telegram Channel: t.me/MonoCoin_Public
🔔 Bot: t.me/MonoCoinSignal_Bot?start=starter_tv
🌐 Website: MonoCoin.net
⭐️ 5-Star TrustPilot: trustpilot.com/review/monocoin.net
免責事項
これらの情報および投稿は、TradingViewが提供または承認する金融、投資、取引、またはその他の種類の助言もしくは推奨であることを意図したものではなく、またこれらに該当するものでもありません。詳細は利用規約をご覧ください。
Join the free Telegram channel
💎 Telegram Channel: t.me/MonoCoin_Public
🔔 Bot: t.me/MonoCoinSignal_Bot?start=starter_tv
🌐 Website: MonoCoin.net
⭐️ 5-Star TrustPilot: trustpilot.com/review/monocoin.net
💎 Telegram Channel: t.me/MonoCoin_Public
🔔 Bot: t.me/MonoCoinSignal_Bot?start=starter_tv
🌐 Website: MonoCoin.net
⭐️ 5-Star TrustPilot: trustpilot.com/review/monocoin.net
免責事項
これらの情報および投稿は、TradingViewが提供または承認する金融、投資、取引、またはその他の種類の助言もしくは推奨であることを意図したものではなく、またこれらに該当するものでもありません。詳細は利用規約をご覧ください。