
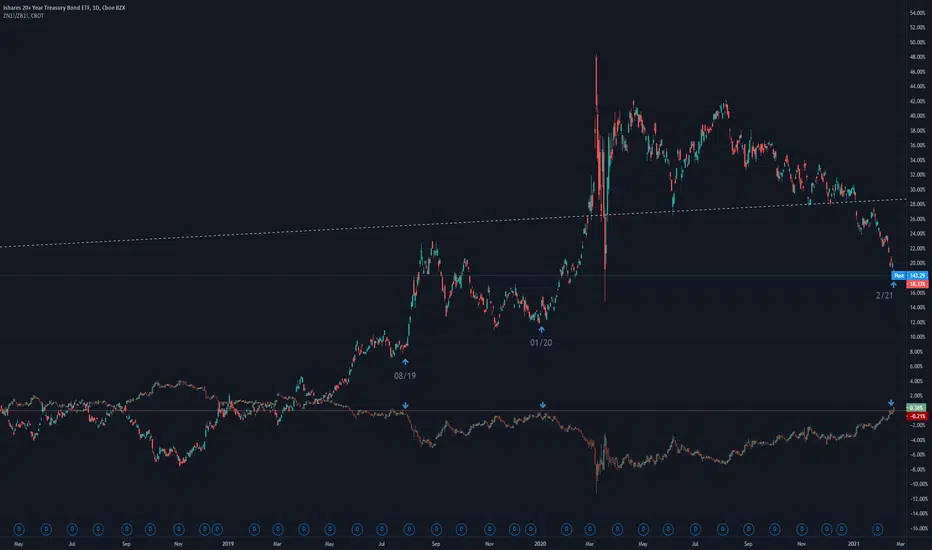
We have here a chart of a TLT with a comparison line of the ZN1!/ZB1!. What I have found is that when the ZN1!/ZB1! ratio hits a resistance level, TLT is also nearing it's bottom. I encourage you to look at the ZN1!/ZB1! separately. Recently, TLT has reversed with strength to the upside once these resistance levels are in range.

免責事項
これらの情報および投稿は、TradingViewが提供または承認する金融、投資、取引、またはその他の種類の助言もしくは推奨であることを意図したものではなく、またこれらに該当するものでもありません。詳細は利用規約をご覧ください。
免責事項
これらの情報および投稿は、TradingViewが提供または承認する金融、投資、取引、またはその他の種類の助言もしくは推奨であることを意図したものではなく、またこれらに該当するものでもありません。詳細は利用規約をご覧ください。