
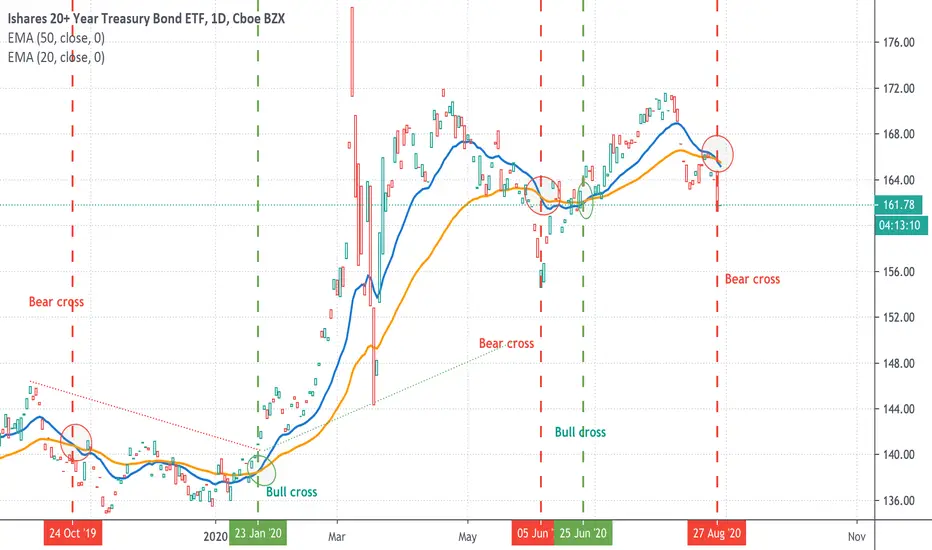
The cross is using the 20 and 50 exponential moving average .
Every time the shorter exponential moving average crosses the longer one, this indicates a bearish signal.
You can see the times this has worked in the past, in the same chart.
Every time the shorter exponential moving average crosses the longer one, this indicates a bearish signal.
You can see the times this has worked in the past, in the same chart.

免責事項
これらの情報および投稿は、TradingViewが提供または承認する金融、投資、取引、またはその他の種類の助言もしくは推奨であることを意図したものではなく、またこれらに該当するものでもありません。詳細は利用規約をご覧ください。
免責事項
これらの情報および投稿は、TradingViewが提供または承認する金融、投資、取引、またはその他の種類の助言もしくは推奨であることを意図したものではなく、またこれらに該当するものでもありません。詳細は利用規約をご覧ください。