
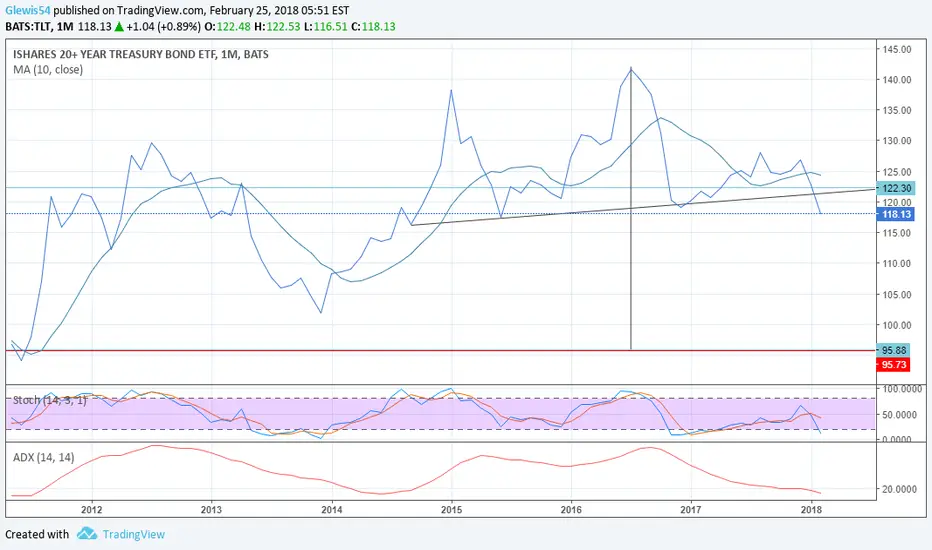
While a regular bar chart shows TLT holding firm at the neckline on a monthly chart, a simple line chart shows that TLT in fact has broken below the head and shoulders neck line. A rally to the neckline and subsequent failure indicates that price can fall below 100 over the long term

免責事項
これらの情報および投稿は、TradingViewが提供または承認する金融、投資、取引、またはその他の種類の助言もしくは推奨であることを意図したものではなく、またこれらに該当するものでもありません。詳細は利用規約をご覧ください。
免責事項
これらの情報および投稿は、TradingViewが提供または承認する金融、投資、取引、またはその他の種類の助言もしくは推奨であることを意図したものではなく、またこれらに該当するものでもありません。詳細は利用規約をご覧ください。