
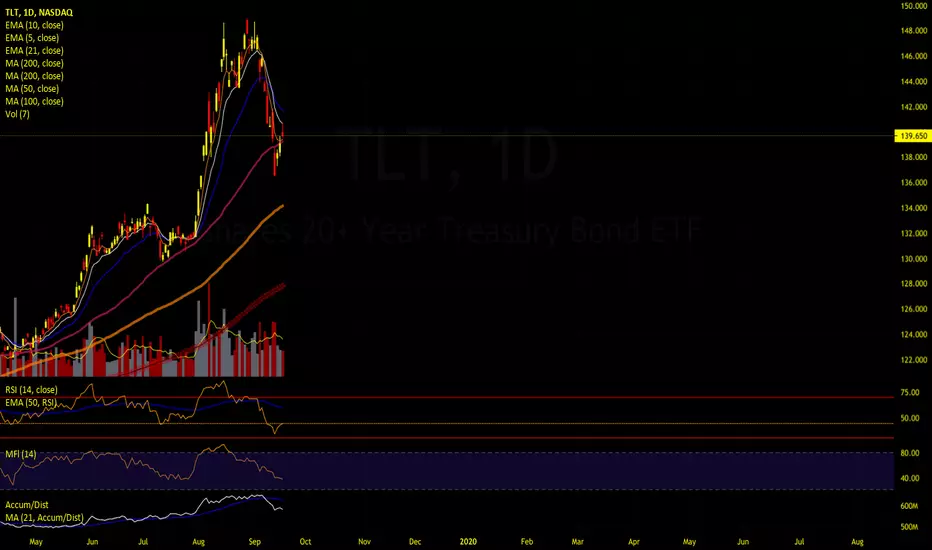
TLT price action on the daily chart showing signs of an overall long term uptrend pattern, making higher highs and higher lows. SMA50 historically acts as a "Major Support" level and is currently showing signs of a potential support there again. RSI levels recently became oversold around 33 RSI, which may greatly increase the odds of a successful trade when combine with SMA50 acting as support.
A potential entry would be end of day if the price closes above both the SMA50 and EMA10
stop set at: if price closes below SMA50 @-1.5%
Exit target set near 46.12 level @ +5%
Risk/Reward ratio good but not grear @ little above 3:1
A potential entry would be end of day if the price closes above both the SMA50 and EMA10
stop set at: if price closes below SMA50 @-1.5%
Exit target set near 46.12 level @ +5%
Risk/Reward ratio good but not grear @ little above 3:1

免責事項
これらの情報および投稿は、TradingViewが提供または承認する金融、投資、取引、またはその他の種類の助言もしくは推奨であることを意図したものではなく、またこれらに該当するものでもありません。詳細は利用規約をご覧ください。
免責事項
これらの情報および投稿は、TradingViewが提供または承認する金融、投資、取引、またはその他の種類の助言もしくは推奨であることを意図したものではなく、またこれらに該当するものでもありません。詳細は利用規約をご覧ください。