ロング
TNY update.
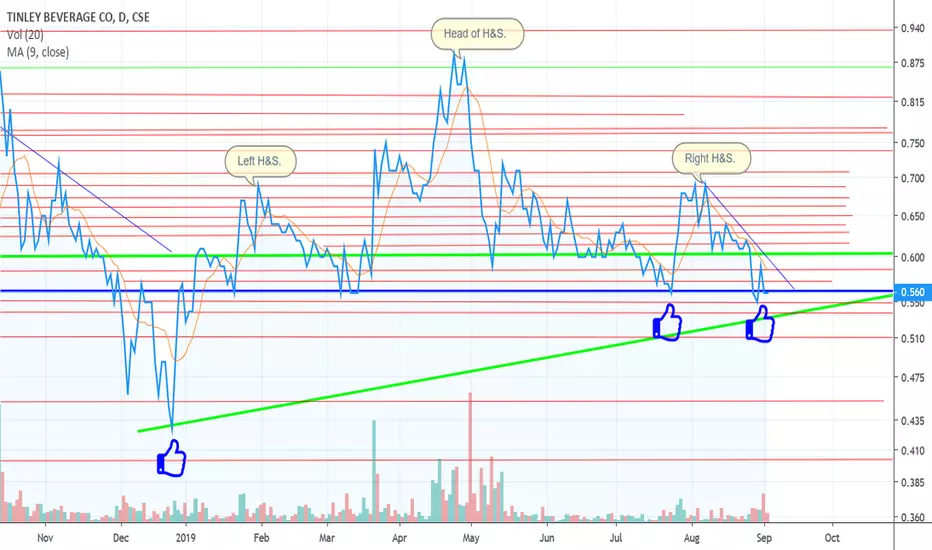
So, since the last time I posted a chart on TNY we were trading in descending triangle that broke to the downside on a "short term time frame." I had mentioned that the pattern could also be a bull flag, but that was not the case.
It is interesting however to see Tinley get back up to the 56c level where there seems to be historic support dating back to Aug 2018.
I can speculate all I want about where the share price may be in the future, but only time will tell per usual.
It is interesting however to see Tinley get back up to the 56c level where there seems to be historic support dating back to Aug 2018.
I can speculate all I want about where the share price may be in the future, but only time will tell per usual.

関連の投稿
免責事項
これらの情報および投稿は、TradingViewが提供または承認する金融、投資、取引、またはその他の種類の助言もしくは推奨であることを意図したものではなく、またこれらに該当するものでもありません。詳細は利用規約をご覧ください。
免責事項
これらの情報および投稿は、TradingViewが提供または承認する金融、投資、取引、またはその他の種類の助言もしくは推奨であることを意図したものではなく、またこれらに該当するものでもありません。詳細は利用規約をご覧ください。