
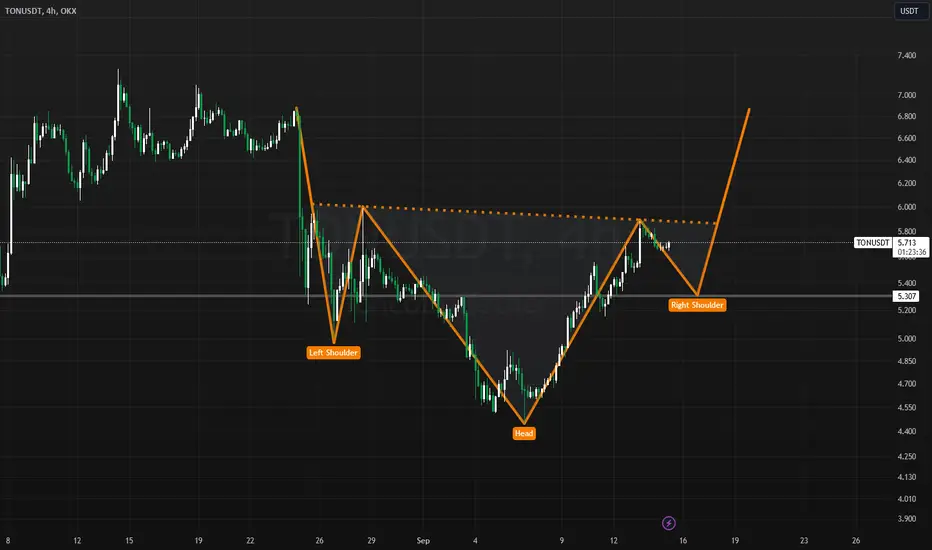
In the latest technical analysis, a bullish "Inverse Head and Shoulders" pattern has appeared. The price started at $6.8, dropping to $5 to form the left shoulder. It then rebounded to $6 before falling to a low of $4.4, marking the head. From there, the price surged back to $5.9, creating the right shoulder.
This pattern is often a strong indicator of a potential bullish reversal, signaling a possible upward move. Traders are now eagerly watching for a breakout above resistance levels, which could confirm the continuation of the uptrend. Will this be the beginning of a new rally?
The next price movement could set the stage for the market's short-term bullish momentum.
This pattern is often a strong indicator of a potential bullish reversal, signaling a possible upward move. Traders are now eagerly watching for a breakout above resistance levels, which could confirm the continuation of the uptrend. Will this be the beginning of a new rally?
The next price movement could set the stage for the market's short-term bullish momentum.

免責事項
これらの情報および投稿は、TradingViewが提供または承認する金融、投資、取引、またはその他の種類の助言もしくは推奨であることを意図したものではなく、またこれらに該当するものでもありません。詳細は利用規約をご覧ください。
免責事項
これらの情報および投稿は、TradingViewが提供または承認する金融、投資、取引、またはその他の種類の助言もしくは推奨であることを意図したものではなく、またこれらに該当するものでもありません。詳細は利用規約をご覧ください。