
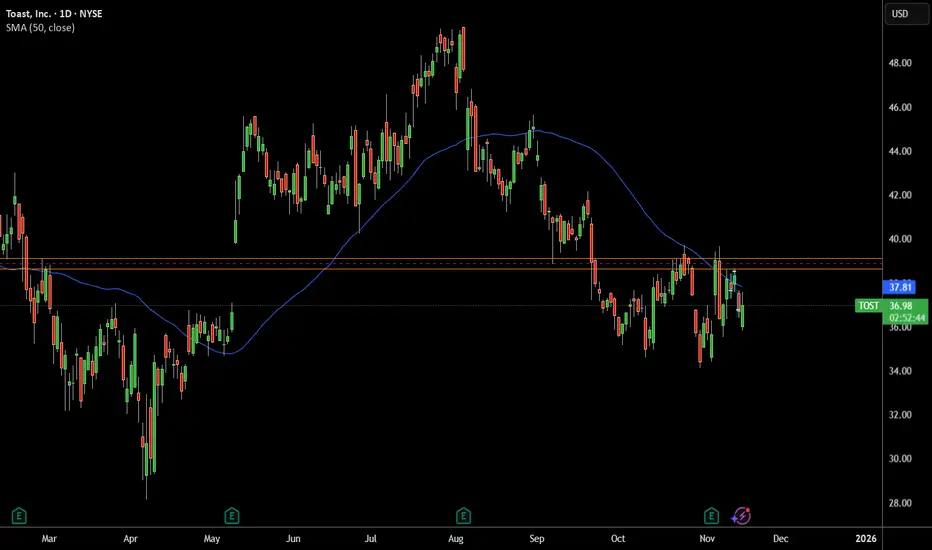
Price Rejected From Major Resistance
The stock is sitting right below a heavy resistance zone around $38–40, which has rejected price multiple times in the past.
Every time TOST comes near this zone, sellers step in → clear bearish supply area.
2. Below the 50-Day Moving Average
Price is trading under the 50 SMA (blue line).
In downtrending or weak stocks, the 50 SMA acts as dynamic resistance, pushing price lower.
3. Lower Highs Formation
The recent bounce failed to create a higher high.
Instead, TOST is forming lower highs, which is a classic bearish continuation signal.
4. Failed Breakout Attempt
TOST tried to break above the resistance but got instantly sold off.
This is a sign of weak buying demand and strong sellers.
The stock is sitting right below a heavy resistance zone around $38–40, which has rejected price multiple times in the past.
Every time TOST comes near this zone, sellers step in → clear bearish supply area.
2. Below the 50-Day Moving Average
Price is trading under the 50 SMA (blue line).
In downtrending or weak stocks, the 50 SMA acts as dynamic resistance, pushing price lower.
3. Lower Highs Formation
The recent bounce failed to create a higher high.
Instead, TOST is forming lower highs, which is a classic bearish continuation signal.
4. Failed Breakout Attempt
TOST tried to break above the resistance but got instantly sold off.
This is a sign of weak buying demand and strong sellers.
トレード終了: 利益確定目標に到達

免責事項
これらの情報および投稿は、TradingViewが提供または承認する金融、投資、取引、またはその他の種類の助言もしくは推奨であることを意図したものではなく、またこれらに該当するものでもありません。詳細は利用規約をご覧ください。
免責事項
これらの情報および投稿は、TradingViewが提供または承認する金融、投資、取引、またはその他の種類の助言もしくは推奨であることを意図したものではなく、またこれらに該当するものでもありません。詳細は利用規約をご覧ください。