
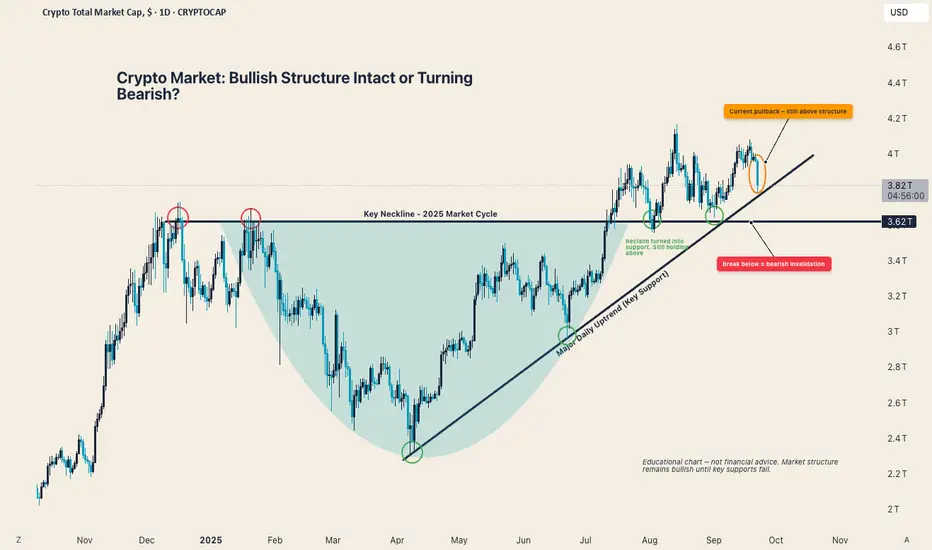
Looking at the Total Market Cap chart, the answer is: not yet.
✅ The daily uptrend line is still intact.
✅ The 2025 cycle neckline is holding as support.
⚠️ If either breaks to the downside, that’s when the structure flips bearish.
For now, the big picture remains bullish until proven otherwise.
✅ The daily uptrend line is still intact.
✅ The 2025 cycle neckline is holding as support.
⚠️ If either breaks to the downside, that’s when the structure flips bearish.
For now, the big picture remains bullish until proven otherwise.

免責事項
これらの情報および投稿は、TradingViewが提供または承認する金融、投資、取引、またはその他の種類の助言もしくは推奨であることを意図したものではなく、またこれらに該当するものでもありません。詳細は利用規約をご覧ください。
免責事項
これらの情報および投稿は、TradingViewが提供または承認する金融、投資、取引、またはその他の種類の助言もしくは推奨であることを意図したものではなく、またこれらに該当するものでもありません。詳細は利用規約をご覧ください。