
I usually keep an eye on TOTAL to get a feeling about the overall crypto market bias. Just like I keep an eye on DXY when it comes to Forex.
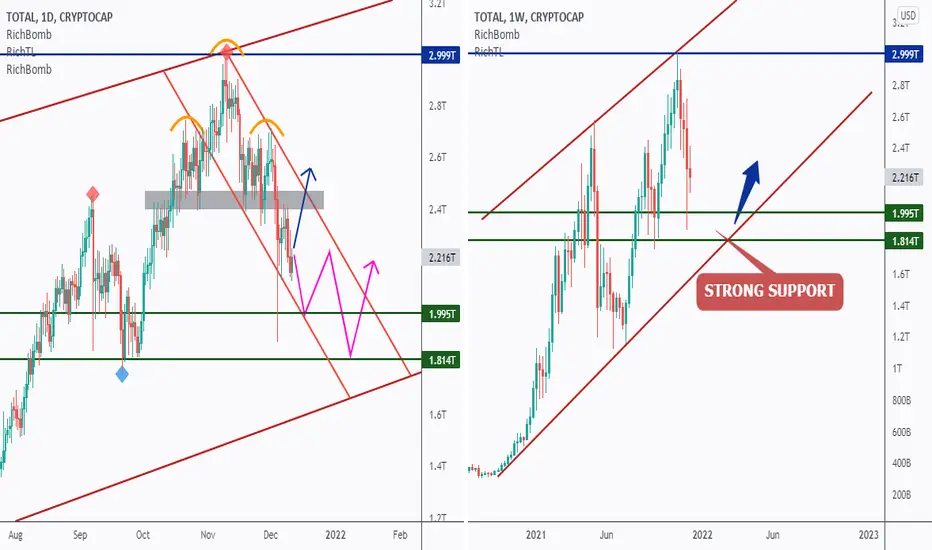
From a long-term perspective, the WEEKLY chart on the right, we all agree that we are still overall bullish.
Technically we are trading inside that big brown channel, and we are currently in a correction phase after rejecting the upper bound / brown trendline and 3T round number.
From a medium-term perspective, the DAILY chart on the left, we had a classic higher high, followed by a lower high, and then a break of the previous low. A classic market structure pattern, known as Head&Shoulders.
After breaking below the head and shoulders neckline, marked in gray, the bears took over and TOTAL started trading inside the red channel, making lower highs and lower lows.
That being said, we know that we are overall bearish, but what are the possible scenarios?
Scenario 1: Projection in Purple
A movement till the lower bound / brown trendline and green support zone is expected before the bulls take over by breaking above the red channel.
Scenario 2: Projection in Blue
A sudden shift in momentum, by an aggressive movement from here to break above the gray zone again, invalidating the red channel, signaling that the bulls are taking full control again.
Which scenario do you think is more likely to happen? and Why?
All Strategies Are Good; If Managed Properly!
~Rich
From a long-term perspective, the WEEKLY chart on the right, we all agree that we are still overall bullish.
Technically we are trading inside that big brown channel, and we are currently in a correction phase after rejecting the upper bound / brown trendline and 3T round number.
From a medium-term perspective, the DAILY chart on the left, we had a classic higher high, followed by a lower high, and then a break of the previous low. A classic market structure pattern, known as Head&Shoulders.
After breaking below the head and shoulders neckline, marked in gray, the bears took over and TOTAL started trading inside the red channel, making lower highs and lower lows.
That being said, we know that we are overall bearish, but what are the possible scenarios?
Scenario 1: Projection in Purple
A movement till the lower bound / brown trendline and green support zone is expected before the bulls take over by breaking above the red channel.
Scenario 2: Projection in Blue
A sudden shift in momentum, by an aggressive movement from here to break above the gray zone again, invalidating the red channel, signaling that the bulls are taking full control again.
Which scenario do you think is more likely to happen? and Why?
All Strategies Are Good; If Managed Properly!
~Rich

📊I help you turn charts into a career
theSignalyst.com
Telegram
t.me/thesignalyst
Trusted Crypto Exchange
cutt.ly/qtwKuPaJ
Trusted CFD Broker
cutt.ly/TickmillReal
Trusted Crypto Prop Firm
cutt.ly/Hyrotrader
theSignalyst.com
Telegram
t.me/thesignalyst
Trusted Crypto Exchange
cutt.ly/qtwKuPaJ
Trusted CFD Broker
cutt.ly/TickmillReal
Trusted Crypto Prop Firm
cutt.ly/Hyrotrader
免責事項
これらの情報および投稿は、TradingViewが提供または承認する金融、投資、取引、またはその他の種類の助言もしくは推奨であることを意図したものではなく、またこれらに該当するものでもありません。詳細は利用規約をご覧ください。
📊I help you turn charts into a career
theSignalyst.com
Telegram
t.me/thesignalyst
Trusted Crypto Exchange
cutt.ly/qtwKuPaJ
Trusted CFD Broker
cutt.ly/TickmillReal
Trusted Crypto Prop Firm
cutt.ly/Hyrotrader
theSignalyst.com
Telegram
t.me/thesignalyst
Trusted Crypto Exchange
cutt.ly/qtwKuPaJ
Trusted CFD Broker
cutt.ly/TickmillReal
Trusted Crypto Prop Firm
cutt.ly/Hyrotrader
免責事項
これらの情報および投稿は、TradingViewが提供または承認する金融、投資、取引、またはその他の種類の助言もしくは推奨であることを意図したものではなく、またこれらに該当するものでもありません。詳細は利用規約をご覧ください。