
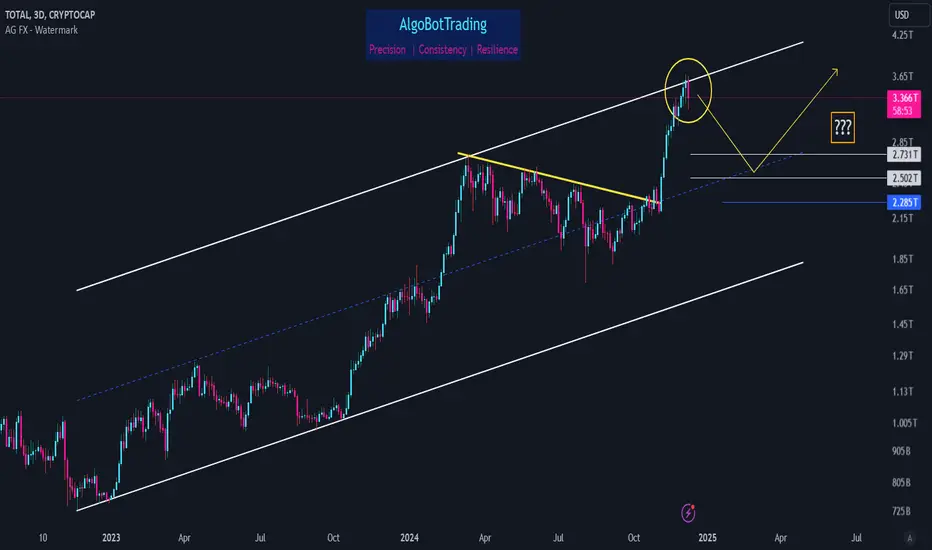
Sometimes a tool as simple as parallel channel can help us identify important support/resistance zones.
Looking at the chart, it's obvious that TOTAL reached 3.6T zone. Not only is this zone the area where a couple of fibs exist, but also it is indeed the upper boundary of the long term ascending channel.
Higher possibility scenario is to see a drop towards 2.5T - 2.73T zone before continuing the rally towards higher level. In order to keep its bullish integrity, TOTAL must not drop below 2.28T level.

免責事項
これらの情報および投稿は、TradingViewが提供または承認する金融、投資、取引、またはその他の種類の助言もしくは推奨であることを意図したものではなく、またこれらに該当するものでもありません。詳細は利用規約をご覧ください。
免責事項
これらの情報および投稿は、TradingViewが提供または承認する金融、投資、取引、またはその他の種類の助言もしくは推奨であることを意図したものではなく、またこれらに該当するものでもありません。詳細は利用規約をご覧ください。