
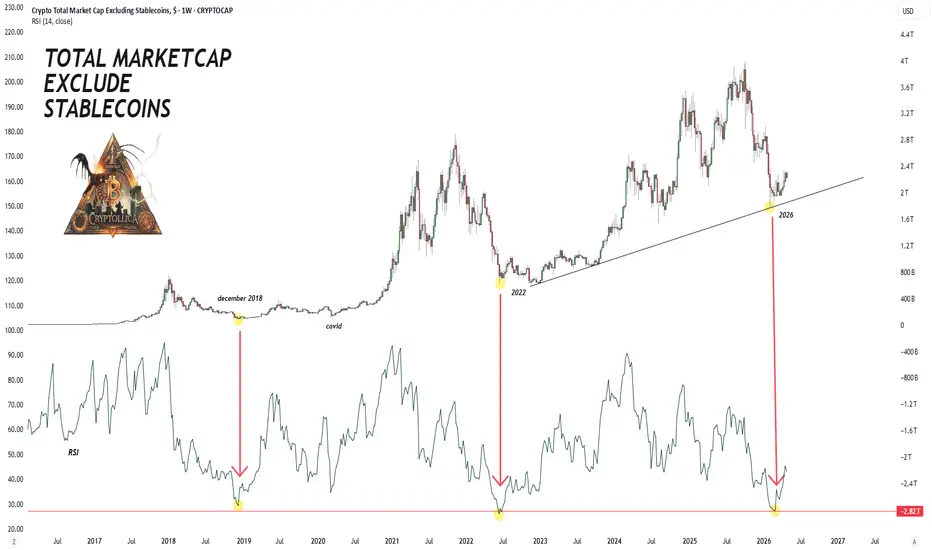
This analysis examines the total cryptocurrency market capitalization excluding stablecoins on a weekly timeframe. As detailed in the chart, the market cap has made a strategic touch on the macro ascending trendline that has formed since the 2022 bottom and serves as a structural floor.
From a technical anatomy perspective, the most critical metric is the historical correlation between price action and the Weekly RSI (Relative Strength Index). Examining the periods marked with red arrows on the chart, it is evident that the periods in December 2018 and mid-2022, where the Weekly RSI touched the lower horizontal support line (oversold territory), established absolute macro bottoms in the crypto market and initiated subsequent long-term rally cycles.
As of the current 2026 period, the price's support on the macro ascending trendline combined with the Weekly RSI testing this historical oversold threshold once again creates a high-probability technical confluence zone. In this consolidation phase, where market volatility and retail interest have contracted, holding above the identified diagonal trendline provides technical evidence that smart money is in an accumulation process.
A high-volume bounce from this trendline would serve as confirmation of a new macro expansion cycle. Conversely, potential weekly closes below the trendline should be monitored as the primary risk factor that would invalidate the current bullish structure.

From a technical anatomy perspective, the most critical metric is the historical correlation between price action and the Weekly RSI (Relative Strength Index). Examining the periods marked with red arrows on the chart, it is evident that the periods in December 2018 and mid-2022, where the Weekly RSI touched the lower horizontal support line (oversold territory), established absolute macro bottoms in the crypto market and initiated subsequent long-term rally cycles.
As of the current 2026 period, the price's support on the macro ascending trendline combined with the Weekly RSI testing this historical oversold threshold once again creates a high-probability technical confluence zone. In this consolidation phase, where market volatility and retail interest have contracted, holding above the identified diagonal trendline provides technical evidence that smart money is in an accumulation process.
A high-volume bounce from this trendline would serve as confirmation of a new macro expansion cycle. Conversely, potential weekly closes below the trendline should be monitored as the primary risk factor that would invalidate the current bullish structure.

▸ Crypto Cycles: cycle phase mapping, structural analysis
▸ Fractals: historical pattern, cycle anatomy
▸ Onchain
▸ Macro
▸ Market Psychology
▸Altcoin Charts
Subscribe on X → @Cryptollica
x.com/Cryptollica/creator-subscriptions/subscribe
▸ Fractals: historical pattern, cycle anatomy
▸ Onchain
▸ Macro
▸ Market Psychology
▸Altcoin Charts
Subscribe on X → @Cryptollica
x.com/Cryptollica/creator-subscriptions/subscribe
免責事項
これらの情報および投稿は、TradingViewが提供または承認する金融、投資、取引、またはその他の種類の助言もしくは推奨であることを意図したものではなく、またこれらに該当するものでもありません。詳細は利用規約をご覧ください。
▸ Crypto Cycles: cycle phase mapping, structural analysis
▸ Fractals: historical pattern, cycle anatomy
▸ Onchain
▸ Macro
▸ Market Psychology
▸Altcoin Charts
Subscribe on X → @Cryptollica
x.com/Cryptollica/creator-subscriptions/subscribe
▸ Fractals: historical pattern, cycle anatomy
▸ Onchain
▸ Macro
▸ Market Psychology
▸Altcoin Charts
Subscribe on X → @Cryptollica
x.com/Cryptollica/creator-subscriptions/subscribe
免責事項
これらの情報および投稿は、TradingViewが提供または承認する金融、投資、取引、またはその他の種類の助言もしくは推奨であることを意図したものではなく、またこれらに該当するものでもありません。詳細は利用規約をご覧ください。