
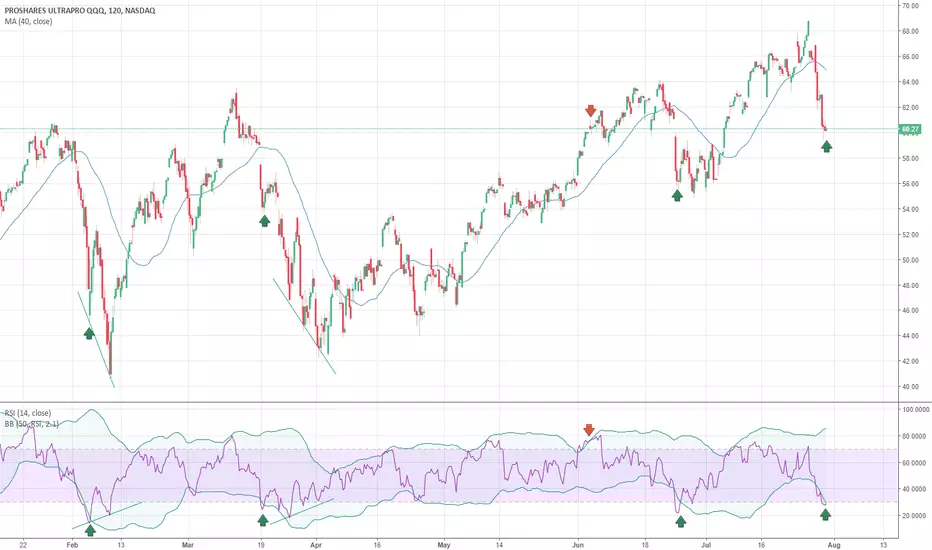
Nasdaq 100 is looking oversold after a bad week for tech. However, after a big selloff the RSI over multiple time frames shows oversold levels. On top of being below the standard 30 level, the RSI dips below the lower adjusted (50 period, 2.1 standard deviations) bollinger band for a more accurate reading of oversold. Over the past 6-months, the combination of the RSI dip below 30 and a dip below the lower band has been an excellent buy signal. Tech isn't going away anytime soon...

免責事項
これらの情報および投稿は、TradingViewが提供または承認する金融、投資、取引、またはその他の種類の助言もしくは推奨であることを意図したものではなく、またこれらに該当するものでもありません。詳細は利用規約をご覧ください。
免責事項
これらの情報および投稿は、TradingViewが提供または承認する金融、投資、取引、またはその他の種類の助言もしくは推奨であることを意図したものではなく、またこれらに該当するものでもありません。詳細は利用規約をご覧ください。