
Hi guys
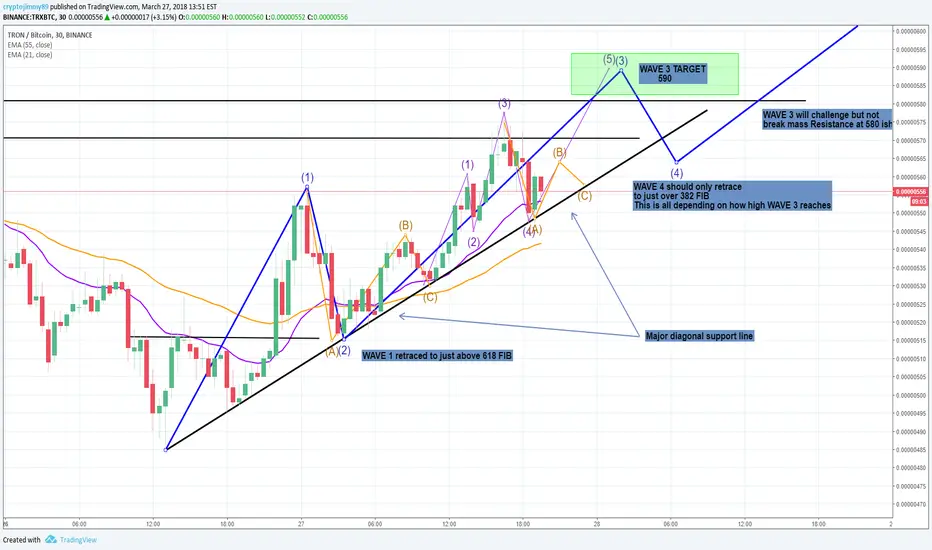
The chart explains it all in detail to be honest... We have found a major support line which is ascending upwards on a diagonal pathway. WAVE 3 will test the major resistance at 580 but not close above it. This will then retrace to around the 382 - 500 FIB levels but also should not break our new support line.
Overall we are on the way to target of 640. On the 31st test net is released and who knows?
The chart explains it all in detail to be honest... We have found a major support line which is ascending upwards on a diagonal pathway. WAVE 3 will test the major resistance at 580 but not close above it. This will then retrace to around the 382 - 500 FIB levels but also should not break our new support line.
Overall we are on the way to target of 640. On the 31st test net is released and who knows?

関連の投稿
免責事項
これらの情報および投稿は、TradingViewが提供または承認する金融、投資、取引、またはその他の種類の助言もしくは推奨であることを意図したものではなく、またこれらに該当するものでもありません。詳細は利用規約をご覧ください。
免責事項
これらの情報および投稿は、TradingViewが提供または承認する金融、投資、取引、またはその他の種類の助言もしくは推奨であることを意図したものではなく、またこれらに該当するものでもありません。詳細は利用規約をご覧ください。