
Analysis on the Hourly:
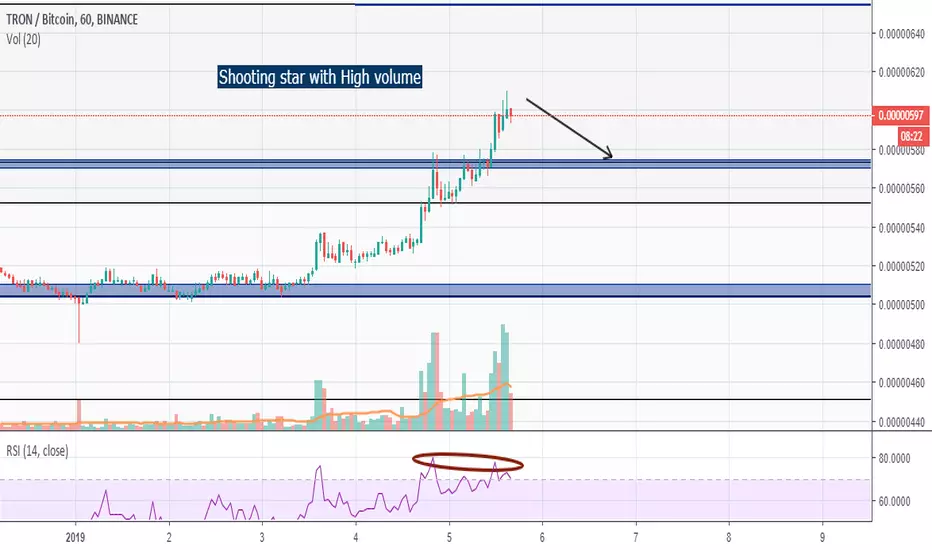
Here we can see a shooting star formed with high volume, this indicates that a lot of selling was done at this point.
If we watch the rsi closely, it formed a double top, which indicates going down.
Now there's two possibilities:
1) Either it keeps going up and touches 652-655 (Fibonacci cluster) ,
2) Or we have a short-term correction to the 570-575.
If 2) occurs, we need to watch that level closely, and find a bullish candle with good volume in order to enter a possible trade to 652-655.
Also, keep in mind that in the 4 hour timeframe, if it forms a hanging man, most likely 2) will occur.
I will keep updating!
If you want to share your ideas , comment down below and like if you enjoyed this analysis.
Here we can see a shooting star formed with high volume, this indicates that a lot of selling was done at this point.
If we watch the rsi closely, it formed a double top, which indicates going down.
Now there's two possibilities:
1) Either it keeps going up and touches 652-655 (Fibonacci cluster) ,
2) Or we have a short-term correction to the 570-575.
If 2) occurs, we need to watch that level closely, and find a bullish candle with good volume in order to enter a possible trade to 652-655.
Also, keep in mind that in the 4 hour timeframe, if it forms a hanging man, most likely 2) will occur.
I will keep updating!
If you want to share your ideas , comment down below and like if you enjoyed this analysis.
ノート
It did the second possibility and rebounded in the fibonacci cluster as predictedトレード終了: 利益確定目標に到達
As told in the analysis, it touched our take profit of 652-655.I will post a new chart if anymore trading opportunities occur.

免責事項
これらの情報および投稿は、TradingViewが提供または承認する金融、投資、取引、またはその他の種類の助言もしくは推奨であることを意図したものではなく、またこれらに該当するものでもありません。詳細は利用規約をご覧ください。
免責事項
これらの情報および投稿は、TradingViewが提供または承認する金融、投資、取引、またはその他の種類の助言もしくは推奨であることを意図したものではなく、またこれらに該当するものでもありません。詳細は利用規約をご覧ください。