
Hello, traders!
Welcome, everyone.
By following me, you can always stay up to date with the latest information.
I hope you have a great day!
-------------------------------------
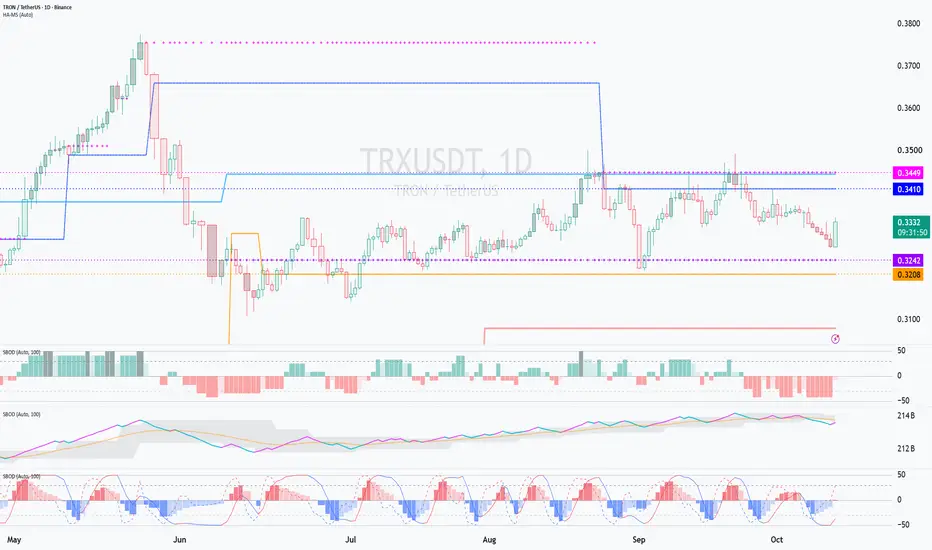
The price has been moving sideways after finding support in the short-term low range of 0.3208–0.3242, rising, and then encountering resistance in the short-term high range of 0.3410–0.3449.
Therefore, our basic trading strategy should focus on how the price behaves when it touches either the 0.3208–0.3242 support range or the 0.3410–0.3449 resistance range.
Accordingly, we need a trading strategy that involves making our main purchases when the price shows signs of finding support near the 0.3208–0.3242 range and taking profits when the price encounters resistance near the 0.3410–0.3449 range.
Outside these key price ranges, we should focus on day trading to generate profits or gradually increase our holdings.
We can make partial purchases when the price finds support within the current Renko brick, reverses into an upward brick, and confirms support, or when it breaks out above the relevant level.
Similarly, we can make partial sales when the price encounters resistance within the current Renko brick, reverses into a downward brick, and confirms resistance, or when it breaks down below the relevant level.
After making these partial trades, we should continue a cycle of trading by selling the purchased amount again to realize profits or repurchasing the amount previously sold at a lower price to increase our holdings.
This approach allows us to maintain a continuous cycle of buying and selling.
To determine whether the current Renko brick is acting as support or resistance, we need to observe which direction the price moves beyond the Long / Short levels.
By combining these two trading strategies, we can improve capital liquidity and maintain greater flexibility in our trading.
Since the current Renko brick is a downward brick, the price needs to rise above 0.3344 to reverse into an upward brick.
However, to sustain the upward momentum, the price must rise above 0.3382 and maintain that level.
The challenge is that the short-term high range is located at 0.3410–0.3449, meaning strong buying pressure will be required for the upward trend to continue.
Therefore, the following conditions should be satisfied to increase the probability of a sustained upward trend.
1. The BSSC indicator must remain above the zero level.
2. The OBV indicator must remain above its High Line.
3. The StochRSI indicator should show upward momentum without having entered the overbought zone.
Until these conditions are satisfied, it is preferable to trade from the perspective of cyclical trading, repeatedly buying and selling within the established price ranges.
If the price rises above the 0.3410–0.3449 range and maintains that level, a stair-step upward trend may develop.
A stair-step upward trend means that the price has already broken above the previous high range, making it essential to strictly follow predetermined stop-loss levels.
Therefore, while maintaining a day-trading approach, we should gradually extend the holding period by adjusting our stop-loss levels upward as the price rises.
On the other hand, if the price falls below the 0.3208–0.3242 range, a stair-step downward trend may develop.
A stair-step downward trend will eventually lead to the formation of a bottom range, where we should prepare to make our main purchases.
However, since we cannot predict how far the price may decline, we need to manage our positions carefully.
After purchasing, if the price begins showing signs of further weakness, we should consider partial sales.
We should also consider partial sales when the price falls below the HA-Low or DOM(-60) indicator levels.
Then, when the price moves below the levels where we previously made partial sales, we can repurchase using the proceeds from those sales to increase our holdings.
If we simply continue buying as the price declines, our investment capital may become exhausted, causing us to miss better buying opportunities.
Therefore, careful capital management is essential.
By switching to lower timeframes, we can also engage in scalping or short-term day trading to generate profits within relatively short periods.
This depends on your personal trading style and how much time you can dedicate to trading.
The trading strategies I have explained so far are based on the 1D chart, meaning that actual trading opportunities may not occur very frequently.
However, just because we establish our trading strategy using the 1D chart does not mean we should trade using only the 1D chart.
Therefore, after establishing a trading strategy based on the 1D chart, we should examine lower-timeframe charts to identify suitable entry and exit points for actual trades.
The low and high price ranges are also displayed on lower-timeframe charts, allowing us to make trading decisions based on whether the price finds support or encounters resistance within those ranges.
It is also helpful to analyze the combined movements of the BSSC, OBV, and StochRSI indicators to determine the likely direction of the price.
In addition, we should observe which direction the price moves beyond the Short–Long range.
By combining the broader trading strategy established on the 1D chart with the more precise entry and exit signals provided by lower-timeframe charts, we can trade more systematically while managing risk and capital efficiently.
-------------------------------------
Thank you for reading to the end.
I wish you successful trading!

[Practical trading strategy using HA-MS and SBOD]
youtu.be/aceN1AttX1Y
[Renko Bot]
readcrypto.kr/live
youtu.be/aceN1AttX1Y
[Renko Bot]
readcrypto.kr/live
関連の投稿
免責事項
これらの情報および投稿は、TradingViewが提供または承認する金融、投資、取引、またはその他の種類の助言もしくは推奨であることを意図したものではなく、またこれらに該当するものでもありません。詳細は利用規約をご覧ください。
[Practical trading strategy using HA-MS and SBOD]
youtu.be/aceN1AttX1Y
[Renko Bot]
readcrypto.kr/live
youtu.be/aceN1AttX1Y
[Renko Bot]
readcrypto.kr/live
関連の投稿
免責事項
これらの情報および投稿は、TradingViewが提供または承認する金融、投資、取引、またはその他の種類の助言もしくは推奨であることを意図したものではなく、またこれらに該当するものでもありません。詳細は利用規約をご覧ください。