
Hello, Hope you all doing well well !
Lets analyse the TRX on Weekly timeframe for a long term investment. :)
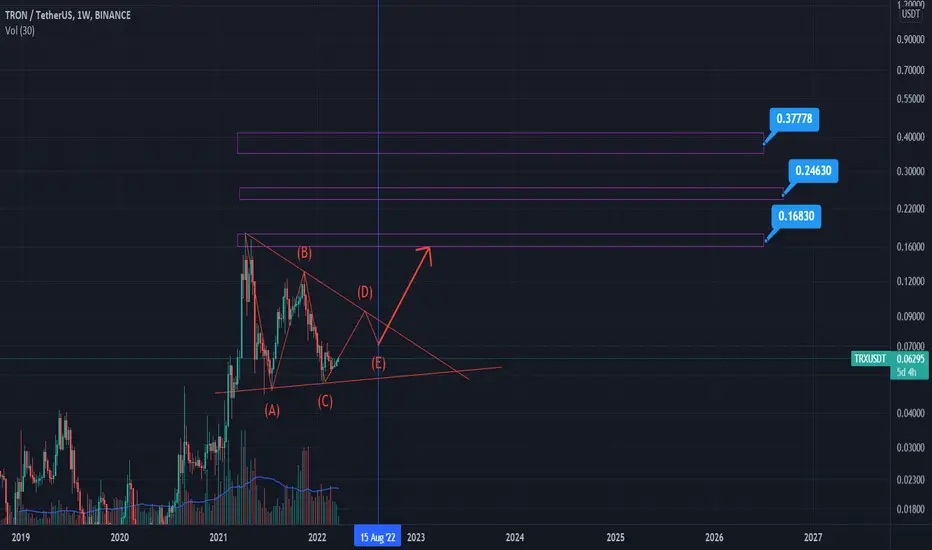
It seems that price is making a triangle with 5 waves ABCDE. According to "fib time zone" tool, we have a important time on august 2022 that it can be the end of E wave. ( last wave ). Then price will increase to the targets which I marked on the chart.
Don't forget the TRX burning inception. Be aware of token burning as well. It can help a lot in the market cap.
3/23/2022
**This analysis is not an incentive to buy or sell and is purely educational.**
Lets analyse the TRX on Weekly timeframe for a long term investment. :)
It seems that price is making a triangle with 5 waves ABCDE. According to "fib time zone" tool, we have a important time on august 2022 that it can be the end of E wave. ( last wave ). Then price will increase to the targets which I marked on the chart.
Don't forget the TRX burning inception. Be aware of token burning as well. It can help a lot in the market cap.
3/23/2022
**This analysis is not an incentive to buy or sell and is purely educational.**
ノート
Hey guys. Hope you all doing well. Just to remember the TRX roadmap
免責事項
これらの情報および投稿は、TradingViewが提供または承認する金融、投資、取引、またはその他の種類の助言もしくは推奨であることを意図したものではなく、またこれらに該当するものでもありません。詳細は利用規約をご覧ください。
免責事項
これらの情報および投稿は、TradingViewが提供または承認する金融、投資、取引、またはその他の種類の助言もしくは推奨であることを意図したものではなく、またこれらに該当するものでもありません。詳細は利用規約をご覧ください。