
Hello people,
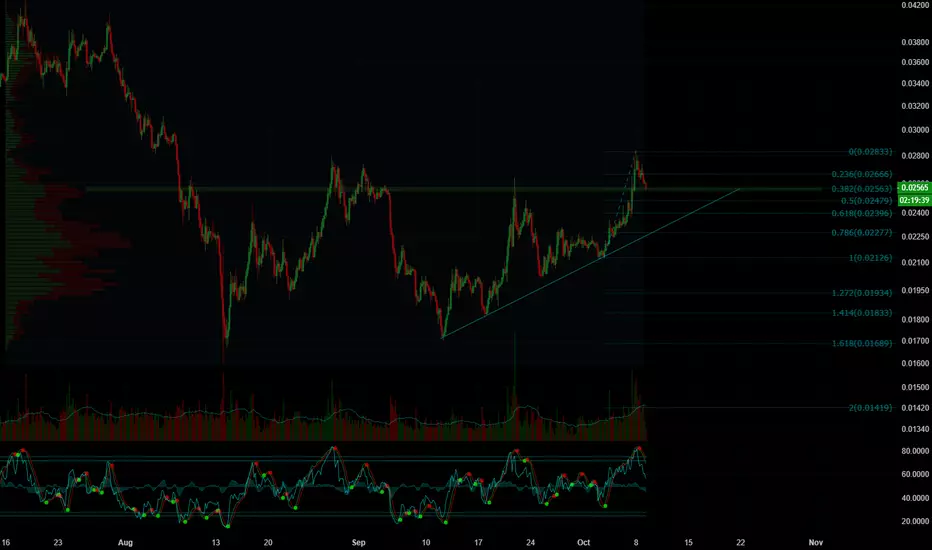
As we can see on the chart, TRX had a massive bullish impulse, but again got rejected from the same resistance.
We can see the picture more clearly on the daily time chart:

Current price is testing 0.382 Fibonacci retracements of the last bullish impulse. This level is also important because it was the last higher high TRON managed to break on a smaller timeframe. If the bulls manage to hold these prices we can soon expect another attempt towards higher high on daily. This scenario would be very bullish.
On TRX/BTC chart TRON looks very good:

It broke massively from the iH&S structure and is now retesting the neckline. If the bulls manage to hold that support line we can expect a huge move to the upside:

Be patient and trade safely.
As we can see on the chart, TRX had a massive bullish impulse, but again got rejected from the same resistance.
We can see the picture more clearly on the daily time chart:
Current price is testing 0.382 Fibonacci retracements of the last bullish impulse. This level is also important because it was the last higher high TRON managed to break on a smaller timeframe. If the bulls manage to hold these prices we can soon expect another attempt towards higher high on daily. This scenario would be very bullish.
On TRX/BTC chart TRON looks very good:
It broke massively from the iH&S structure and is now retesting the neckline. If the bulls manage to hold that support line we can expect a huge move to the upside:
Be patient and trade safely.

免責事項
これらの情報および投稿は、TradingViewが提供または承認する金融、投資、取引、またはその他の種類の助言もしくは推奨であることを意図したものではなく、またこれらに該当するものでもありません。詳細は利用規約をご覧ください。
免責事項
これらの情報および投稿は、TradingViewが提供または承認する金融、投資、取引、またはその他の種類の助言もしくは推奨であることを意図したものではなく、またこれらに該当するものでもありません。詳細は利用規約をご覧ください。