
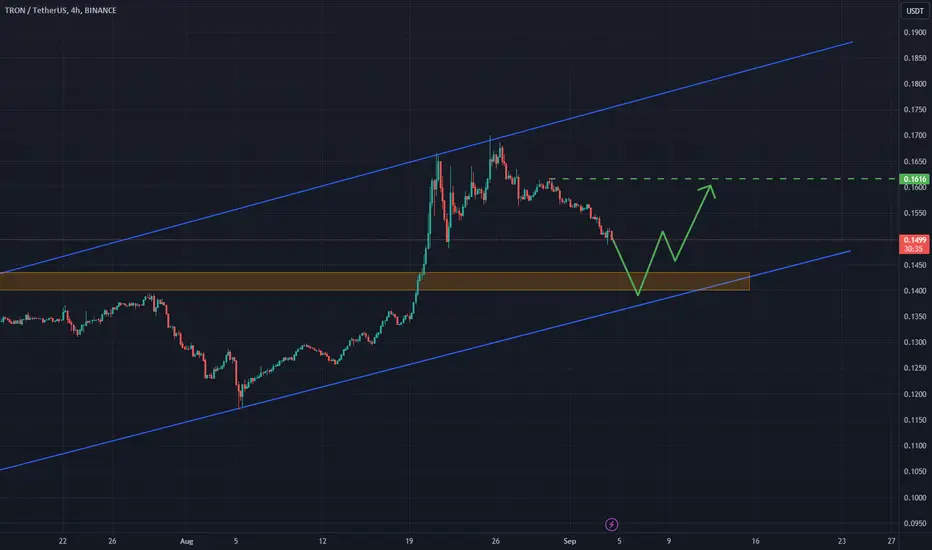
TRXUSDT is currently pulling back after forming a double top at a resistance zone. The price is now testing a previous support level, and there is a chance it could dip below this support, given the liquidity below this level and near the February highs. The market has already seen a pullback of around 12%, with the potential to extend to a 15% pullback. This price action might develop into a trend continuation pattern, possibly forming a triangle as it consolidates. If the market finds sufficient buying pressure at these lower levels, it could set the stage for a future upward move. The target is the resistance zone around 0.1618

Website - rtedinvesting.com/
Free Telegram Channel - t.me/rtedinvestingofficialfreechannel
Free Telegram Channel - t.me/rtedinvestingofficialfreechannel
免責事項
これらの情報および投稿は、TradingViewが提供または承認する金融、投資、取引、またはその他の種類の助言もしくは推奨であることを意図したものではなく、またこれらに該当するものでもありません。詳細は利用規約をご覧ください。
Website - rtedinvesting.com/
Free Telegram Channel - t.me/rtedinvestingofficialfreechannel
Free Telegram Channel - t.me/rtedinvestingofficialfreechannel
免責事項
これらの情報および投稿は、TradingViewが提供または承認する金融、投資、取引、またはその他の種類の助言もしくは推奨であることを意図したものではなく、またこれらに該当するものでもありません。詳細は利用規約をご覧ください。