
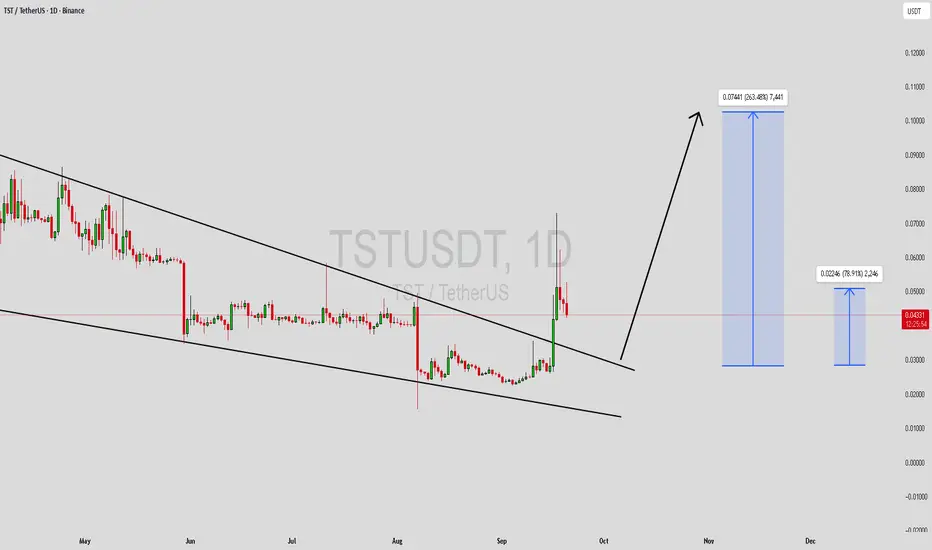
TSTUSDT is forming a classic falling wedge pattern, a bullish reversal setup that often signals the end of a downtrend and the beginning of a powerful upward move. The chart structure shows price compression with lower highs and steady support levels, indicating that sellers are losing momentum while buyers are preparing for a potential breakout. With solid trading volume supporting this formation, the probability of a breakout rally looks strong, aligning with the expected gain projection of 240% to 250%+.
The falling wedge pattern is highly regarded in technical analysis because it tends to precede explosive moves when confirmed by a breakout above resistance. In TSTUSDT, the price action suggests that accumulation is taking place, which typically fuels significant upside once buyers take full control. This makes the setup particularly attractive for traders looking to position themselves ahead of a potential major rally.
Investor interest is steadily increasing in this project, which adds to the bullish outlook. With liquidity growing and momentum indicators pointing toward strength, TSTUSDT has the potential to deliver outsized gains if market sentiment remains supportive. The setup offers a strong risk-to-reward ratio, making it a pair worth watching closely in the coming sessions.
✅ Show your support by hitting the like button and
✅ Leaving a comment below! (What is You opinion about this Coin)
Your feedback and engagement keep me inspired to share more insightful market analysis with you!

🟢🟢🟢🟢🟢🟢 🟢🟢🟢Join Our Telegram Here to Get Trades With Entry And Exit 🟢🟢🟢
👇👇👇👇👇👇
linktr.ee/TelegramChannel777
🟢🟢🟢
👇👇👇👇👇👇
linktr.ee/TelegramChannel777
🟢🟢🟢
免責事項
これらの情報および投稿は、TradingViewが提供または承認する金融、投資、取引、またはその他の種類の助言もしくは推奨であることを意図したものではなく、またこれらに該当するものでもありません。詳細は利用規約をご覧ください。
🟢🟢🟢🟢🟢🟢 🟢🟢🟢Join Our Telegram Here to Get Trades With Entry And Exit 🟢🟢🟢
👇👇👇👇👇👇
linktr.ee/TelegramChannel777
🟢🟢🟢
👇👇👇👇👇👇
linktr.ee/TelegramChannel777
🟢🟢🟢
免責事項
これらの情報および投稿は、TradingViewが提供または承認する金融、投資、取引、またはその他の種類の助言もしくは推奨であることを意図したものではなく、またこれらに該当するものでもありません。詳細は利用規約をご覧ください。