
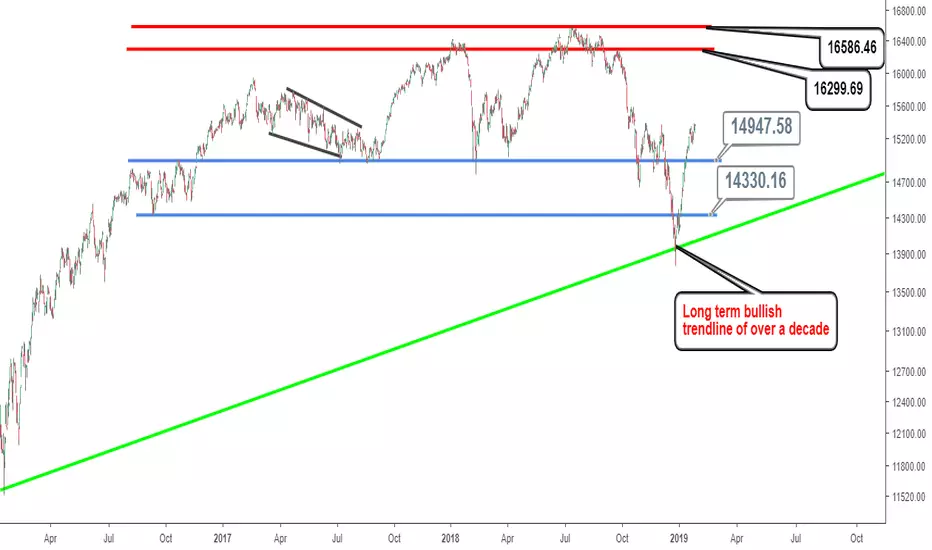
Price action closed on December 24, 2018 below major support between 14,947.58 and 14,330.16. Moreover same close on December 24, 2018 saw price action close below its bullish trendline that has lasted over a decade.
Both scenarios above do call for a huge caution and/or warning for the current uptrend in the TSX. The market condition for the TSX in this case is therefore a downtrend to a side trend at best.
Resistance or overhead supply lies between 16,586.46 and 16,299.69.
The sideways market condition for the TSX considered in this analysis is better referred to as a rectangle top formation (tentative) that exists mainly between the upper boundary of support i.e. 16,586.46 and lower boundary of resistance i.e. 16,299.69.
Price breaking out above the high made on July 13, 2018 of 16,586.46 marks the resumption of the uptrend in the TSX.
Both scenarios above do call for a huge caution and/or warning for the current uptrend in the TSX. The market condition for the TSX in this case is therefore a downtrend to a side trend at best.
Resistance or overhead supply lies between 16,586.46 and 16,299.69.
The sideways market condition for the TSX considered in this analysis is better referred to as a rectangle top formation (tentative) that exists mainly between the upper boundary of support i.e. 16,586.46 and lower boundary of resistance i.e. 16,299.69.
Price breaking out above the high made on July 13, 2018 of 16,586.46 marks the resumption of the uptrend in the TSX.

関連の投稿
免責事項
これらの情報および投稿は、TradingViewが提供または承認する金融、投資、取引、またはその他の種類の助言もしくは推奨であることを意図したものではなく、またこれらに該当するものでもありません。詳細は利用規約をご覧ください。
関連の投稿
免責事項
これらの情報および投稿は、TradingViewが提供または承認する金融、投資、取引、またはその他の種類の助言もしくは推奨であることを意図したものではなく、またこれらに該当するものでもありません。詳細は利用規約をご覧ください。