
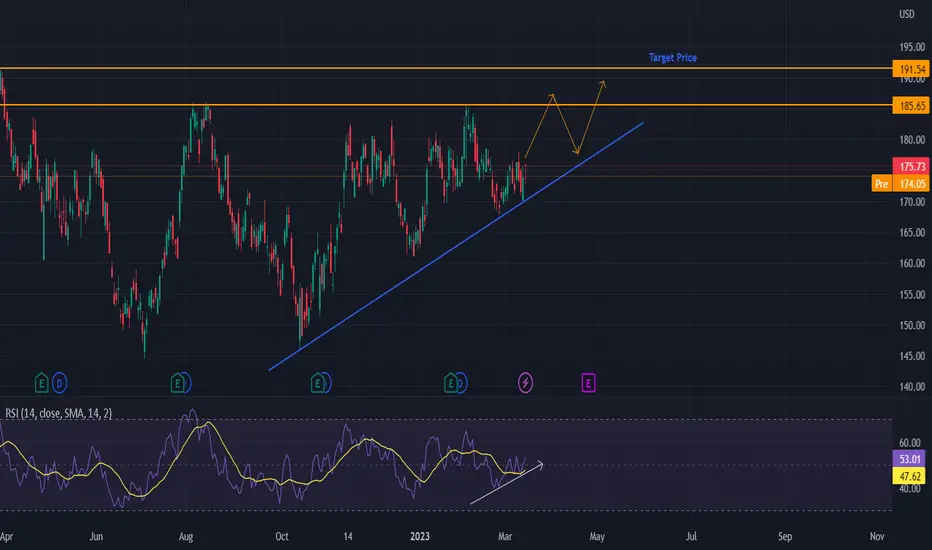
On the chart we can see that there are higher highs and higher lows. The RSI indicator crossing above the 50 mark and heading upward, indicates a bullish momentum. We expect that the price will reach the resistance. As it is a strong resistance, we anticipate the price to get rejected. Next, we expect another upsloping attempt towards the resistance level. Invalidation of this theses would be if the price closes below the upsloping trendline.
ノート
The price got rejected from the resistance and found support on the upsloping rendline again. So far so good. The target price remains unchanged.
💥 Free signals and ideas ➡ t.me/vfinvestment
関連の投稿
免責事項
これらの情報および投稿は、TradingViewが提供または承認する金融、投資、取引、またはその他の種類の助言もしくは推奨であることを意図したものではなく、またこれらに該当するものでもありません。詳細は利用規約をご覧ください。
💥 Free signals and ideas ➡ t.me/vfinvestment
関連の投稿
免責事項
これらの情報および投稿は、TradingViewが提供または承認する金融、投資、取引、またはその他の種類の助言もしくは推奨であることを意図したものではなく、またこれらに該当するものでもありません。詳細は利用規約をご覧ください。