
RedKTrader のその他の限定インジケーター
月額$49.99で The RedKTrader Pro Toolbox を購読すると、このクリエイターの限定インジケーターを入手できます。お支払いはTradingView上で完結し、すぐにチャート上で利用できます。
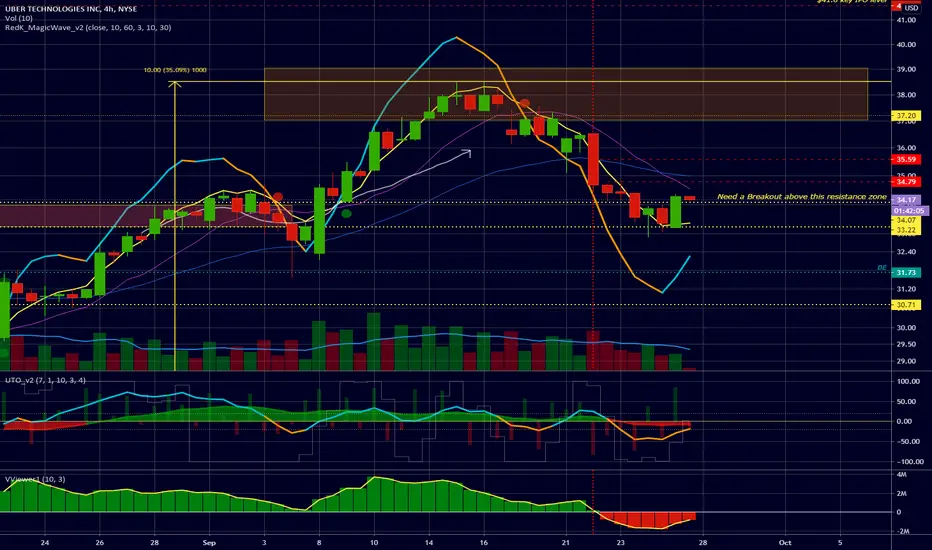
The RedKTrader Pro Toolbox を見るThe previous price projection was bulls-eye accurate. Uber hit the $38.5 level and switched downward. i didn't close the long there -- there's really little use of having a good projection if we don't act on it, right : ) ?
V.Viewer tells us the next balance point if another move up is to happen, is somewhere between the 2 red lines $34.8 to $35.6'ish -- which is also where the 30MA on a 4hr would be. the chart tells us that if UBER can successfully overcome that zone, there's a possibility of continuation up.
what does the daily chart tell us?
the 1D chart looks good - especially with today' action - there's bullish long term sentiment - so the winds can carry the next move forward - and the weakness in the short-term momentum is kind of declining, switching into strength

conclusion:
-------------
not closing the long now and will hold - will share next projection once we have a reliable formation.
feel free to share thoughts if you think otherwise.
-----------------------
How do i read this chart setup
we look at the price action (top chart) and recent key S/R price levels, plus the insights from 3 key elements: momentum, sentiment and buy/sell pressure
- the calculated short-term price momentum is shown by the UTO blue/amber line
- the long term sentiment is represented by the UTO Green/Red area graph - the demand/supply pressure is expressed by the v.viewer green/red area graph - let's call these "the context"
How do i trade this chart setup
- the Basic rule: nothing can predict what happens tomorrow - but if no external catalysts interfere, it's *highly probable* that a price move with strong momentum that's in alignment with the broader context (sentiment and buy/sell pressure) would continue in the same direction (e.g., a breakout).
V.Viewer tells us the next balance point if another move up is to happen, is somewhere between the 2 red lines $34.8 to $35.6'ish -- which is also where the 30MA on a 4hr would be. the chart tells us that if UBER can successfully overcome that zone, there's a possibility of continuation up.
what does the daily chart tell us?
the 1D chart looks good - especially with today' action - there's bullish long term sentiment - so the winds can carry the next move forward - and the weakness in the short-term momentum is kind of declining, switching into strength
conclusion:
-------------
not closing the long now and will hold - will share next projection once we have a reliable formation.
feel free to share thoughts if you think otherwise.
-----------------------
How do i read this chart setup
we look at the price action (top chart) and recent key S/R price levels, plus the insights from 3 key elements: momentum, sentiment and buy/sell pressure
- the calculated short-term price momentum is shown by the UTO blue/amber line
- the long term sentiment is represented by the UTO Green/Red area graph - the demand/supply pressure is expressed by the v.viewer green/red area graph - let's call these "the context"
How do i trade this chart setup
- the Basic rule: nothing can predict what happens tomorrow - but if no external catalysts interfere, it's *highly probable* that a price move with strong momentum that's in alignment with the broader context (sentiment and buy/sell pressure) would continue in the same direction (e.g., a breakout).

🌐 RedKTrader.com/
"Understand the market. Trade your way."
TA Research & Coaching.
Pro tools on classic TA: EVEREX · VADER · TPX · VARSI · CoRA WAve
Tri-View MTF system & TACT Coaching Series
𝕏: @RedKTrader
"Understand the market. Trade your way."
TA Research & Coaching.
Pro tools on classic TA: EVEREX · VADER · TPX · VARSI · CoRA WAve
Tri-View MTF system & TACT Coaching Series
𝕏: @RedKTrader
関連の投稿
免責事項
これらの情報および投稿は、TradingViewが提供または承認する金融、投資、取引、またはその他の種類の助言もしくは推奨であることを意図したものではなく、またこれらに該当するものでもありません。詳細は利用規約をご覧ください。
🌐 RedKTrader.com/
"Understand the market. Trade your way."
TA Research & Coaching.
Pro tools on classic TA: EVEREX · VADER · TPX · VARSI · CoRA WAve
Tri-View MTF system & TACT Coaching Series
𝕏: @RedKTrader
"Understand the market. Trade your way."
TA Research & Coaching.
Pro tools on classic TA: EVEREX · VADER · TPX · VARSI · CoRA WAve
Tri-View MTF system & TACT Coaching Series
𝕏: @RedKTrader
関連の投稿
免責事項
これらの情報および投稿は、TradingViewが提供または承認する金融、投資、取引、またはその他の種類の助言もしくは推奨であることを意図したものではなく、またこれらに該当するものでもありません。詳細は利用規約をご覧ください。