
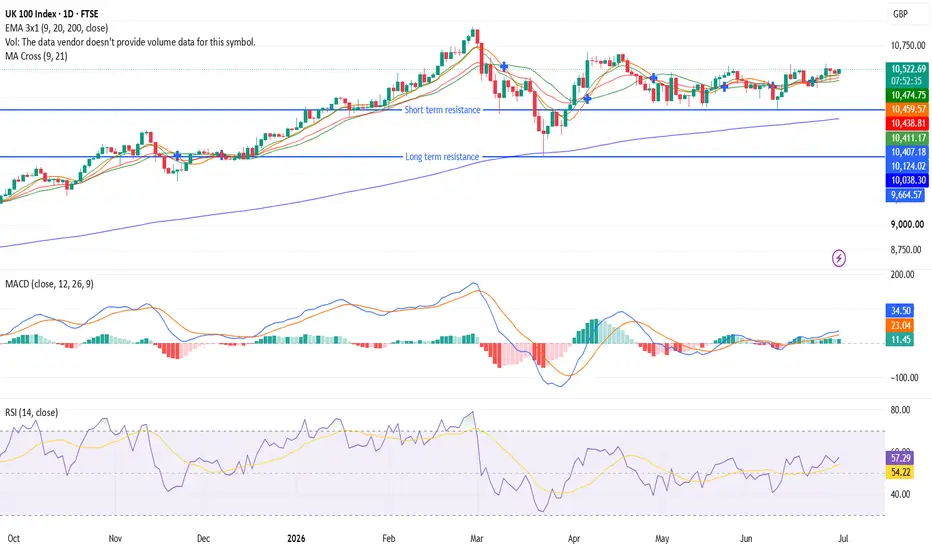
UK 100 comes into its final day of June at a peculiar state as a benchmark in a very strong position with a year-to-date increase of 19.67% that has brought it close to its historical highs without having any sense of urgency either way. UK 100 closed down for a second consecutive session on Monday, reaching just below 10,484 amid a temporary end of hostilities between the US and Iran prior to peace talks, which is usually a bullish signal but which has not sparked a significant risk rally and only generated a very lukewarm response. It has been the corporate news that had an impact on individual stocks rather than the macro environment on the index itself. Specifically, British American Tobacco went down by more than 1% amid confirmation of plans to reduce the size of its total global staff by some 20%, while BT was up by 1.4% on account of a partnership deal with Verizon.
This is reflected in the price, which captures the same feeling of being on hold, not that of conviction. The reality behind the price action is the fact that the index is sitting very close to its own MA Cross short term, which is an indication itself. 9 and 21 MA Cross is sitting at 9,674 and 9,643 respectively, both meaningfully lower than current price, while the more immediate EMAs 9 and 20 are clustering each other at 9,667 and 9,663, level which was abandoned in May during its move up and has been consolidating above since then. Clustered short-term averages, rather than separated, is a language of chart of an equilibrium market. RSI speaks in a similar balance. It sits above neutral 50 level with its signal line only fractionally below it ;there is no spread between them, which indicates the absence of any momentum edge for either buyers or sellers.It is certainly a much different scenario than what took place in March, where the spread of the RSI increased considerably amid the sharp reversal lower in the index from its highs. In terms of the MACD, there is some positive information hiding beneath the surface. The MACD line is sitting above the signal line, making the overall pattern constructive, and the histogram has slowly been building small bars on the positive side following a stretch in April and May of negative bars.
Trade recommendation
Direction: Long
Entry horizon: 10,400 – 10,460 (pullback toward the EMA 9/20 cluster and recent consolidation floor)
Primary target: 10,650
Secondary target: 10,829
Stop loss: 10,124
Technical scenarios
Range resolution higher: Driven by progress in Iran peace talks, this bullish path requires a daily close above 10,650 and RSI rising past 58–60. Targets include 10,829 and the 11,000 psychological level.
Continued consolidation: As the most likely near-term outcome, the index should trade between the 10,400 support and 10,650 resistance. With neutral momentum, the market is waiting for clearer geopolitical or economic signals.
Bearish breakdown: A daily close below the 10,124 EMA 200 support would signal a structural shift. Considered the lowest-probability scenario, this would likely require failed ceasefire talks or a hawkish Bank of England surprise.
This is reflected in the price, which captures the same feeling of being on hold, not that of conviction. The reality behind the price action is the fact that the index is sitting very close to its own MA Cross short term, which is an indication itself. 9 and 21 MA Cross is sitting at 9,674 and 9,643 respectively, both meaningfully lower than current price, while the more immediate EMAs 9 and 20 are clustering each other at 9,667 and 9,663, level which was abandoned in May during its move up and has been consolidating above since then. Clustered short-term averages, rather than separated, is a language of chart of an equilibrium market. RSI speaks in a similar balance. It sits above neutral 50 level with its signal line only fractionally below it ;there is no spread between them, which indicates the absence of any momentum edge for either buyers or sellers.It is certainly a much different scenario than what took place in March, where the spread of the RSI increased considerably amid the sharp reversal lower in the index from its highs. In terms of the MACD, there is some positive information hiding beneath the surface. The MACD line is sitting above the signal line, making the overall pattern constructive, and the histogram has slowly been building small bars on the positive side following a stretch in April and May of negative bars.
Trade recommendation
Direction: Long
Entry horizon: 10,400 – 10,460 (pullback toward the EMA 9/20 cluster and recent consolidation floor)
Primary target: 10,650
Secondary target: 10,829
Stop loss: 10,124
Technical scenarios
Range resolution higher: Driven by progress in Iran peace talks, this bullish path requires a daily close above 10,650 and RSI rising past 58–60. Targets include 10,829 and the 11,000 psychological level.
Continued consolidation: As the most likely near-term outcome, the index should trade between the 10,400 support and 10,650 resistance. With neutral momentum, the market is waiting for clearer geopolitical or economic signals.
Bearish breakdown: A daily close below the 10,124 EMA 200 support would signal a structural shift. Considered the lowest-probability scenario, this would likely require failed ceasefire talks or a hawkish Bank of England surprise.

Join PrimeXBT via the link below: go.appxbt.link/my6s/vf8j1cp5
免責事項
これらの情報および投稿は、TradingViewが提供または承認する金融、投資、取引、またはその他の種類の助言もしくは推奨であることを意図したものではなく、またこれらに該当するものでもありません。詳細は利用規約をご覧ください。
Join PrimeXBT via the link below: go.appxbt.link/my6s/vf8j1cp5
免責事項
これらの情報および投稿は、TradingViewが提供または承認する金融、投資、取引、またはその他の種類の助言もしくは推奨であることを意図したものではなく、またこれらに該当するものでもありません。詳細は利用規約をご覧ください。