
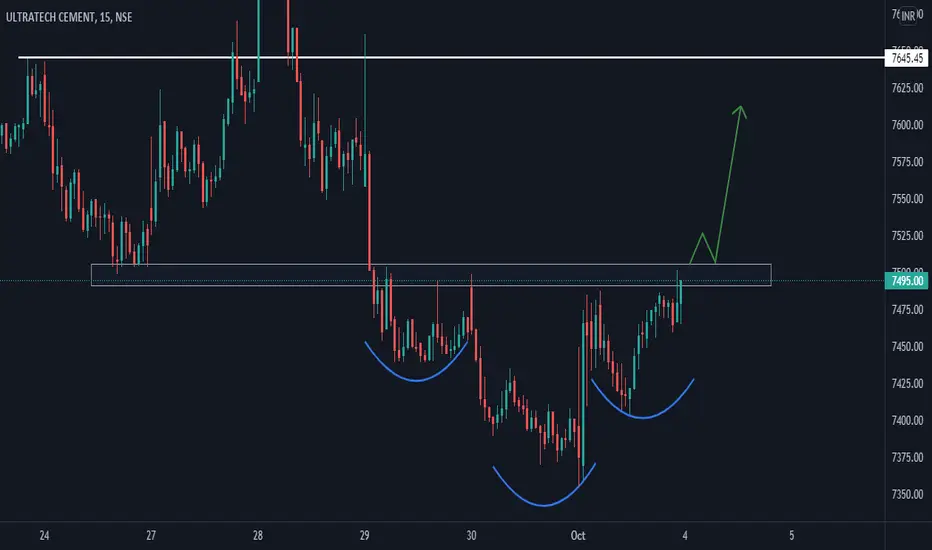
EXPLANATION: This is a 15 min time frame chart of ULTRACEMCO . The stock has been in a downtrend for days and has formed an Inverted head and shoulders pattern. If stock give a strong breakout and broke its supply zone with volumes and has retested the same. I am bullish on ULTRACEMCO .
If you like this analysis give a Like // Follow for more updates , let me know in comments below :)
If you like this analysis give a Like // Follow for more updates , let me know in comments below :)

免責事項
これらの情報および投稿は、TradingViewが提供または承認する金融、投資、取引、またはその他の種類の助言もしくは推奨であることを意図したものではなく、またこれらに該当するものでもありません。詳細は利用規約をご覧ください。
免責事項
これらの情報および投稿は、TradingViewが提供または承認する金融、投資、取引、またはその他の種類の助言もしくは推奨であることを意図したものではなく、またこれらに該当するものでもありません。詳細は利用規約をご覧ください。