
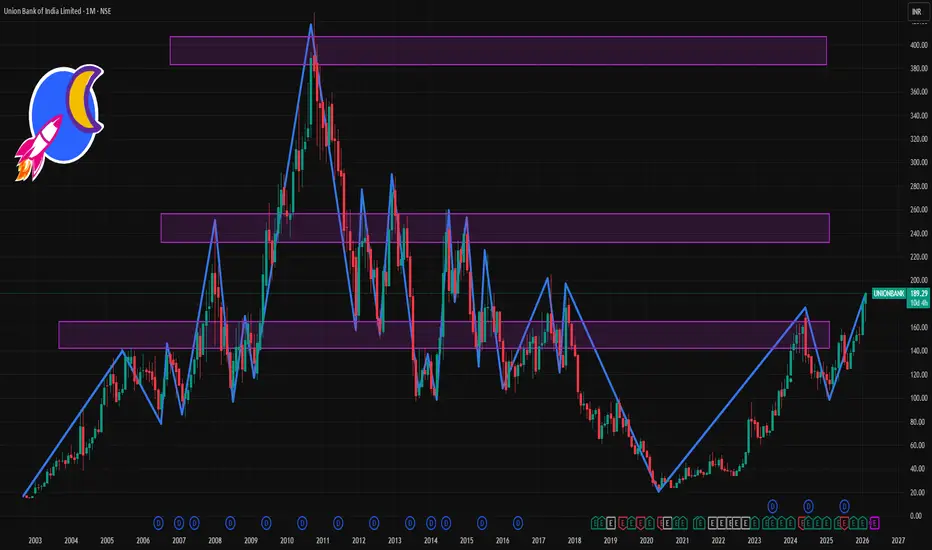
📊 Current Price Snapshot
Approximate live price: ~₹182 – ₹187 per share today.
52-week range: ~₹106 (low) — ₹189 (high).
Recent trend over the last 1 month shows a positive move with gains around +9 % (1-M return).
📈 1-Month Key Technical Levels
🛑 Resistance (Upside)
Levels where price could slow down or face selling pressure:
₹188 – ₹190 – near recent highs/52-week peak zone (major resistance).
₹185 – ₹187 – near short-term resistance cluster around current prices.
₹192 + – psychological/round-number resistance above recent swing highs. (round number)
Interpretation: A clean daily close above ~₹190 could indicate further upside continuation.
🟩 Support (Downside)
Zones where price may find buying support on pullbacks:
₹178 – ₹179 – immediate 1-month support around pivot/near intraday lows.
₹175 – ₹176 – secondary support where short-term buyers step in.
₹170 – ₹172 – deeper support aligned with multi-week retracement consolidation.
Interpretation: If price dips below ₹178 and fails to reclaim it, deeper correction towards ₹170 is possible.
📌 What This Means (1-Month View)
📉 Bullish Signs
Price trading near 52-week highs with generally positive momentum over 30 days.
1-month performance strong, suggesting accumulation.
📉 Risk / Pullback Levels
Breakdown below ₹175 – ₹172 zone increases risk of corrective sell-offs.
Strong support zone remains between ₹170 – ₹172.

Contact Knowledgehub for a detailed consultation: Dm on WhatsApp: [wa.link/a2o0kz]-
Phone No: [+91 93102 26243]-
Email: [tradingviewknowledgehub@gmail.com]---
-- Let’s achieve success together!
Phone No: [+91 93102 26243]-
Email: [tradingviewknowledgehub@gmail.com]---
-- Let’s achieve success together!
関連の投稿
免責事項
これらの情報および投稿は、TradingViewが提供または承認する金融、投資、取引、またはその他の種類の助言もしくは推奨であることを意図したものではなく、またこれらに該当するものでもありません。詳細は利用規約をご覧ください。