アップデート済
Nasdaq Inverse Head & Shoulders
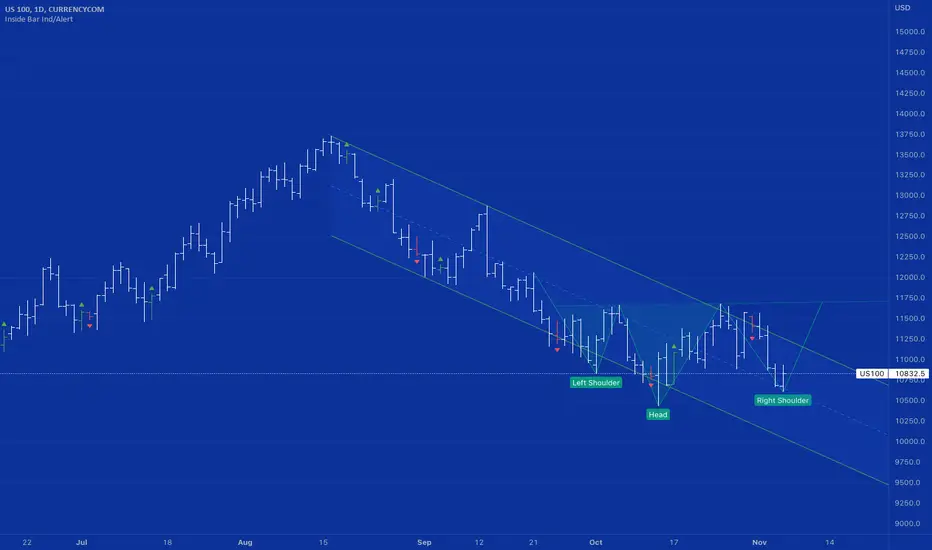
If the retail trading pattern plays out, price action will break out of this descending channel.
The only way I see this accelerating is if we get a continued decline in the US dollar. Nothing else has changed geopolitically or economically.
Monetarists still believe that increased rate hikes will bring down the economy, yet the Atlanta Fed's own GDPNow model is signaling a healthy +3%~4% growth.
The Fed will be raising rates but this increase is going to start to slow down. It's not like they will do another 75% and then >75%. If anything it will go down in 25bps moves.
Inflation of asset prices, inflation of monetary base and inflationary prices are different things and we probably need a new word to describe what is happening within the asset and price's space. As
“Inflation is always and everywhere a monetary phenomenon, in the sense that it is and can be produced only by a more rapid increase in the quantity of money than in output.”
QE did not cause inflation.
Supply chain shocks and shutting down a global economy did.
Copper rose sharply on Friday and has made a new high on the monthly consolidation pattern. If China doesn't show economic expansion, I would expect this latest move to be undone.
The only way I see this accelerating is if we get a continued decline in the US dollar. Nothing else has changed geopolitically or economically.
Monetarists still believe that increased rate hikes will bring down the economy, yet the Atlanta Fed's own GDPNow model is signaling a healthy +3%~4% growth.
The Fed will be raising rates but this increase is going to start to slow down. It's not like they will do another 75% and then >75%. If anything it will go down in 25bps moves.
Inflation of asset prices, inflation of monetary base and inflationary prices are different things and we probably need a new word to describe what is happening within the asset and price's space. As
“Inflation is always and everywhere a monetary phenomenon, in the sense that it is and can be produced only by a more rapid increase in the quantity of money than in output.”
QE did not cause inflation.
Supply chain shocks and shutting down a global economy did.
Copper rose sharply on Friday and has made a new high on the monthly consolidation pattern. If China doesn't show economic expansion, I would expect this latest move to be undone.
ノート
US100 getting pretty close to a break of the Neckline
ノート
Inverse Head and Shoulders competes. For those that speculate on these patterns the target is x2 the distance from the head to the neck line
ノート
getting some movement following x3 data points.Empire State Manufacturing Index
PPI m/m
Core PPI m/m
Manufacturing came in better than expected , whereas PPI dropped below expectations
ノート
Non Farm Payrolls - higher than expected, and an increase to the previous month
関連の投稿
免責事項
これらの情報および投稿は、TradingViewが提供または承認する金融、投資、取引、またはその他の種類の助言もしくは推奨であることを意図したものではなく、またこれらに該当するものでもありません。詳細は利用規約をご覧ください。
免責事項
これらの情報および投稿は、TradingViewが提供または承認する金融、投資、取引、またはその他の種類の助言もしくは推奨であることを意図したものではなく、またこれらに該当するものでもありません。詳細は利用規約をご覧ください。