ロング
Nasdaq100 Index
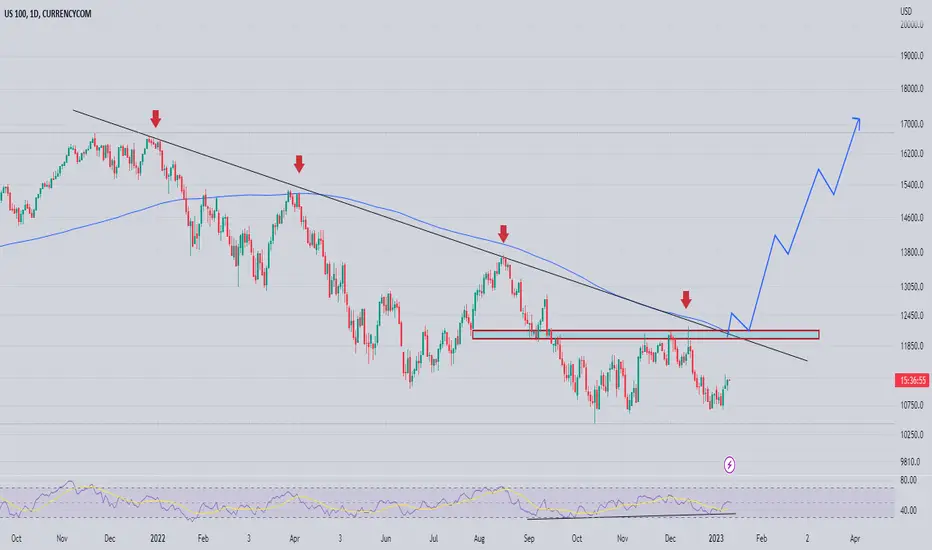
Looks Like Long Downtrend Is Over
Rsi printed bulish divergence failed to make New Low Now we have resistances like 200sma trendline resistance = horizental resistance
us100 needs to breaks thiese hurdels then on retest can enter for long
Rsi printed bulish divergence failed to make New Low Now we have resistances like 200sma trendline resistance = horizental resistance
us100 needs to breaks thiese hurdels then on retest can enter for long

Follow Us On Telegram & Twitter For Regular Updates
Crypto Telegram Public Channel
t.me/worldofchartsfx
Forex Telegram Channel
t.me/worldofchartsfx01
Follow Us On X / Twitter
x.com/WorldOfCharts1
Crypto Telegram Public Channel
t.me/worldofchartsfx
Forex Telegram Channel
t.me/worldofchartsfx01
Follow Us On X / Twitter
x.com/WorldOfCharts1
免責事項
これらの情報および投稿は、TradingViewが提供または承認する金融、投資、取引、またはその他の種類の助言もしくは推奨であることを意図したものではなく、またこれらに該当するものでもありません。詳細は利用規約をご覧ください。
Follow Us On Telegram & Twitter For Regular Updates
Crypto Telegram Public Channel
t.me/worldofchartsfx
Forex Telegram Channel
t.me/worldofchartsfx01
Follow Us On X / Twitter
x.com/WorldOfCharts1
Crypto Telegram Public Channel
t.me/worldofchartsfx
Forex Telegram Channel
t.me/worldofchartsfx01
Follow Us On X / Twitter
x.com/WorldOfCharts1
免責事項
これらの情報および投稿は、TradingViewが提供または承認する金融、投資、取引、またはその他の種類の助言もしくは推奨であることを意図したものではなく、またこれらに該当するものでもありません。詳細は利用規約をご覧ください。