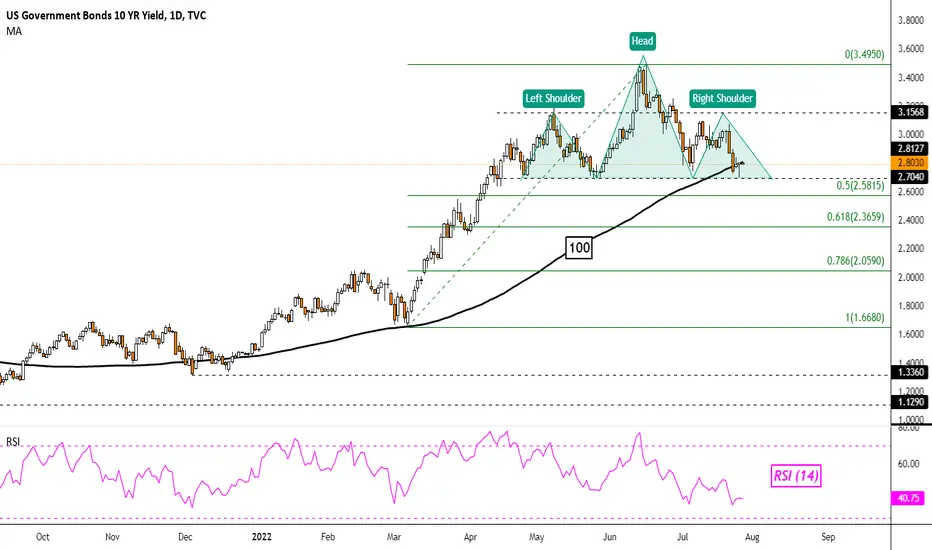
The 10-Year Treasury yield has been consolidating since April as traders grappled with inflation and recession woes.
Now, a bearish Head & Shoulders chart formation is prevailing. At the time of publishing, prices finished forming the right shoulder and were trading at the neckline, which seems to be around 2.70.
This is as the 100-day Simple Moving Average is holding up as support. It could still maintain the dominant uptrend.
Otherwise, confirming a breakout under the neckline and the moving average may open the door to a broader reversal.
Key levels to watch to the downside include the 61.8% and 78.6% Fibonacci retracements at 2.36 and 2.05 respectively. Beyond the latter sits the March low at 1.66.
Overturning the Head & Shoulders entails a push above the right shoulder, which is just below 3.15.
 US10Y
US10Y
Now, a bearish Head & Shoulders chart formation is prevailing. At the time of publishing, prices finished forming the right shoulder and were trading at the neckline, which seems to be around 2.70.
This is as the 100-day Simple Moving Average is holding up as support. It could still maintain the dominant uptrend.
Otherwise, confirming a breakout under the neckline and the moving average may open the door to a broader reversal.
Key levels to watch to the downside include the 61.8% and 78.6% Fibonacci retracements at 2.36 and 2.05 respectively. Beyond the latter sits the March low at 1.66.
Overturning the Head & Shoulders entails a push above the right shoulder, which is just below 3.15.
US10Y
関連の投稿
免責事項
これらの情報および投稿は、TradingViewが提供または承認する金融、投資、取引、またはその他の種類の助言もしくは推奨であることを意図したものではなく、またこれらに該当するものでもありません。詳細は利用規約をご覧ください。
免責事項
これらの情報および投稿は、TradingViewが提供または承認する金融、投資、取引、またはその他の種類の助言もしくは推奨であることを意図したものではなく、またこれらに該当するものでもありません。詳細は利用規約をご覧ください。