
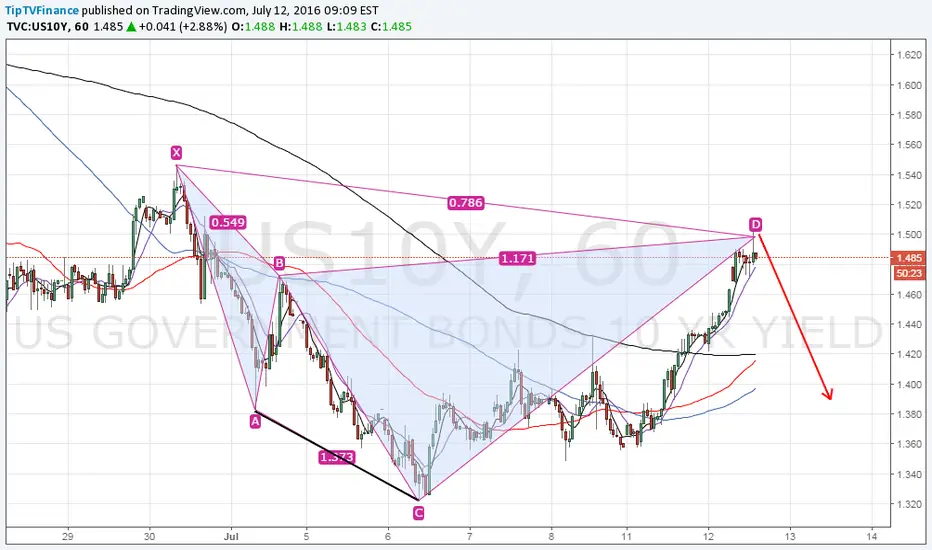
About 5 days ago, I had pointed to the possible Bearish Cypher formation on the 10-yr treasury yield. The pattern stands completed today.
Point D = 1.499% = potential reversal zone (PRZ) has been tested. As per the pattern, we should be heading down from here. For related markets this means -
US stocks may be in for correction
USD/JPY rally could run out of steam if treasury yields slips from PRZ
Point D = 1.499% = potential reversal zone (PRZ) has been tested. As per the pattern, we should be heading down from here. For related markets this means -
US stocks may be in for correction
USD/JPY rally could run out of steam if treasury yields slips from PRZ

関連の投稿
免責事項
これらの情報および投稿は、TradingViewが提供または承認する金融、投資、取引、またはその他の種類の助言もしくは推奨であることを意図したものではなく、またこれらに該当するものでもありません。詳細は利用規約をご覧ください。
免責事項
これらの情報および投稿は、TradingViewが提供または承認する金融、投資、取引、またはその他の種類の助言もしくは推奨であることを意図したものではなく、またこれらに該当するものでもありません。詳細は利用規約をご覧ください。