
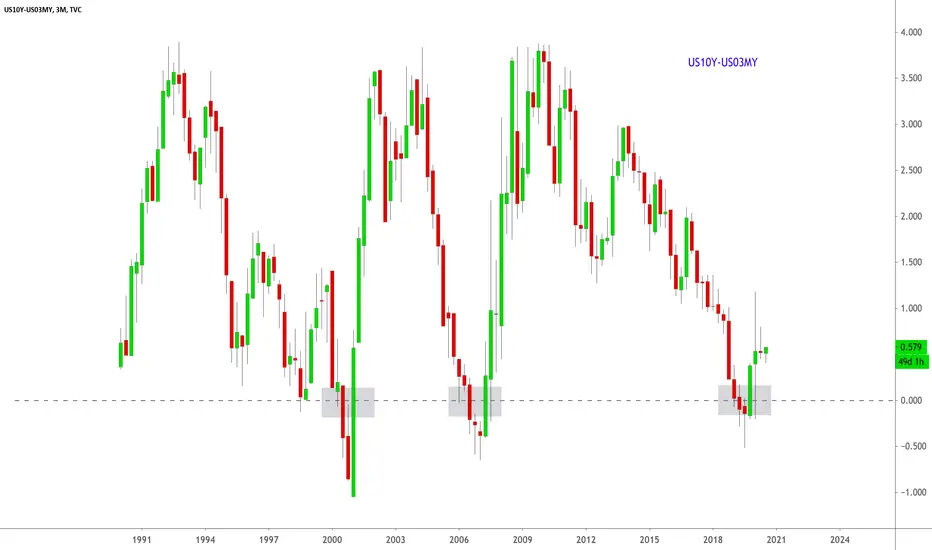
This was the first chart that signaled a recession in April of 2020 when the curve first inverted last year in May. This was pure luck, by simply drawing a fractal of previous yield curve inversions from past recessions from May, which was around 360 days from the TA that suggested the market would recess in April of 2020. Obviously covid is a black-swan--unpredictable and un-speculative--however the bond markets continue to get this all correct, 6-12 months in advance.
Keep your tabs on the curve.
Keep your tabs on the curve.

関連の投稿
免責事項
これらの情報および投稿は、TradingViewが提供または承認する金融、投資、取引、またはその他の種類の助言もしくは推奨であることを意図したものではなく、またこれらに該当するものでもありません。詳細は利用規約をご覧ください。
免責事項
これらの情報および投稿は、TradingViewが提供または承認する金融、投資、取引、またはその他の種類の助言もしくは推奨であることを意図したものではなく、またこれらに該当するものでもありません。詳細は利用規約をご覧ください。