
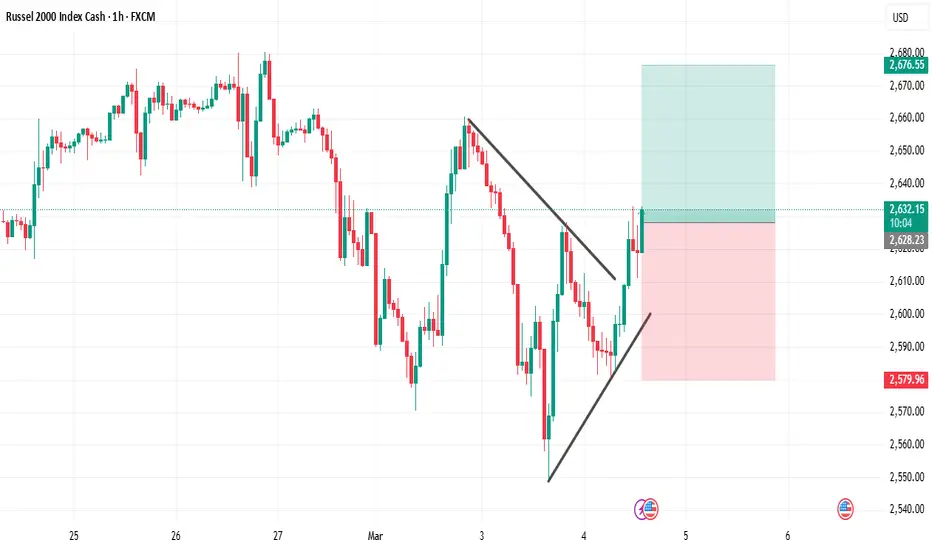
The Russell 2000 formed a symmetrical triangle after a strong sell-off, showing a period of compression where volatility started to decrease. These structures often precede a momentum expansion once price breaks out of the pattern.
Price has now broken above the triangle resistance, suggesting that short-term momentum could shift to the upside.
Entry 2628
Stop Loss 2579
TP 2676
Price has now broken above the triangle resistance, suggesting that short-term momentum could shift to the upside.
Entry 2628
Stop Loss 2579
TP 2676
トレード終了: ストップロスに到達
Trade did not catch enough momentum. Trading plan respected
免責事項
これらの情報および投稿は、TradingViewが提供または承認する金融、投資、取引、またはその他の種類の助言もしくは推奨であることを意図したものではなく、またこれらに該当するものでもありません。詳細は利用規約をご覧ください。
免責事項
これらの情報および投稿は、TradingViewが提供または承認する金融、投資、取引、またはその他の種類の助言もしくは推奨であることを意図したものではなく、またこれらに該当するものでもありません。詳細は利用規約をご覧ください。