
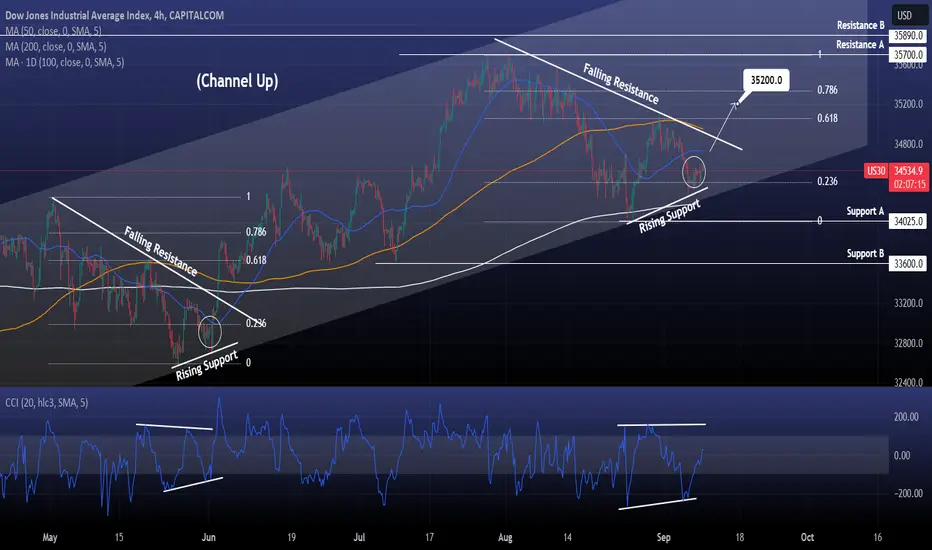
Dow Jones / US30 has formed the 2nd leg of the bottom sequence on the Rising Support and the 0.236 Fibonacci level at the bottom of the Channel Up.
This is a similar formation to May, also on a Rising Support. Once the Falling Resistance broke, the price almost reached the 0.786 Fibonacci level, before making a Higher High.
The CCI between the two patterns is also indentical.
If the price crosses over the 4hour MA50, buy and target 35200.
Previous chart:

Follow us, like the idea and leave a comment below!!
This is a similar formation to May, also on a Rising Support. Once the Falling Resistance broke, the price almost reached the 0.786 Fibonacci level, before making a Higher High.
The CCI between the two patterns is also indentical.
If the price crosses over the 4hour MA50, buy and target 35200.
Previous chart:
Follow us, like the idea and leave a comment below!!

thecryptagon.com covers news & insights on global markets (crypto, forex, stocks, commodities)
Institutional services offered:
💰 Daily consulting
💰 Account management
💰 Mentorship
Contact: t.me/thecryptagon | info@thecryptagon.com
Institutional services offered:
💰 Daily consulting
💰 Account management
💰 Mentorship
Contact: t.me/thecryptagon | info@thecryptagon.com
免責事項
これらの情報および投稿は、TradingViewが提供または承認する金融、投資、取引、またはその他の種類の助言もしくは推奨であることを意図したものではなく、またこれらに該当するものでもありません。詳細は利用規約をご覧ください。
thecryptagon.com covers news & insights on global markets (crypto, forex, stocks, commodities)
Institutional services offered:
💰 Daily consulting
💰 Account management
💰 Mentorship
Contact: t.me/thecryptagon | info@thecryptagon.com
Institutional services offered:
💰 Daily consulting
💰 Account management
💰 Mentorship
Contact: t.me/thecryptagon | info@thecryptagon.com
免責事項
これらの情報および投稿は、TradingViewが提供または承認する金融、投資、取引、またはその他の種類の助言もしくは推奨であることを意図したものではなく、またこれらに該当するものでもありません。詳細は利用規約をご覧ください。