
US30 Sell Technical Analysis
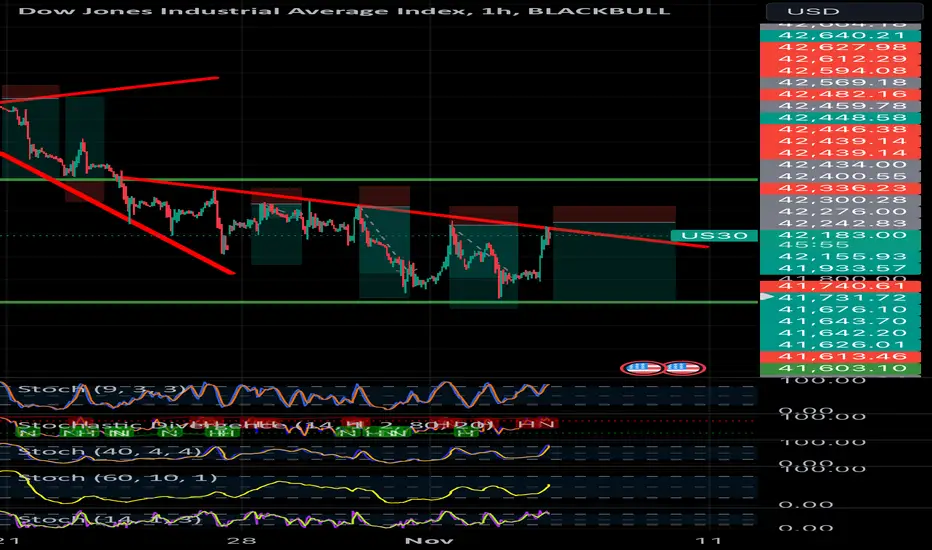
The US30 Dow Jones Industrial Average is currently showing a downtrend on the 1-hour chart, as evidenced by the descending trendline and multiple failed attempts to break above resistance. The Stochastic indicators also suggest overbought conditions, with the potential for a downward movement as momentum appears to be weakening. Additionally, previous rejections at the resistance zone highlight seller dominance in this range. A break below the support levels could accelerate selling pressure, making it a favorable setup for a short position.
The US30 Dow Jones Industrial Average is currently showing a downtrend on the 1-hour chart, as evidenced by the descending trendline and multiple failed attempts to break above resistance. The Stochastic indicators also suggest overbought conditions, with the potential for a downward movement as momentum appears to be weakening. Additionally, previous rejections at the resistance zone highlight seller dominance in this range. A break below the support levels could accelerate selling pressure, making it a favorable setup for a short position.

免責事項
これらの情報および投稿は、TradingViewが提供または承認する金融、投資、取引、またはその他の種類の助言もしくは推奨であることを意図したものではなく、またこれらに該当するものでもありません。詳細は利用規約をご覧ください。
免責事項
これらの情報および投稿は、TradingViewが提供または承認する金融、投資、取引、またはその他の種類の助言もしくは推奨であることを意図したものではなく、またこれらに該当するものでもありません。詳細は利用規約をご覧ください。