
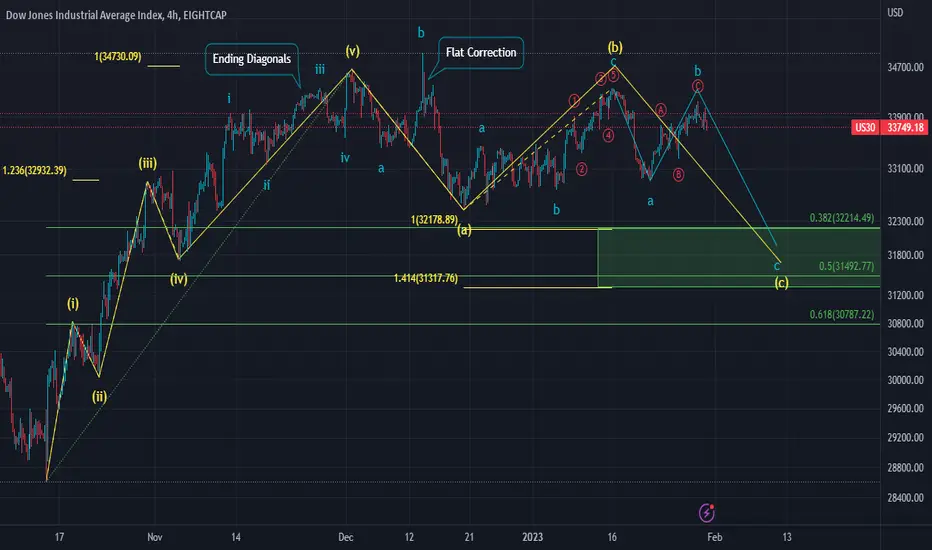
I have broken down the entire wave structure of the upward impulse which started in October 2022 up to today.
The chart is self explanatory and consist of my main wave count of US30 Index. Right now we are starting our Wave C of corrective cycle which is expected to bottom in the given range but the outlook can change depending on the upcoming news.
The chart is self explanatory and consist of my main wave count of US30 Index. Right now we are starting our Wave C of corrective cycle which is expected to bottom in the given range but the outlook can change depending on the upcoming news.
トレード稼働中
Since the News came as expected i.e. 25 points increase, the market reacted bullish changing the sub-wave structure as shown in chart below.Though I am still bearish at this point and expecting market to drop starting tomorrow.

関連の投稿
免責事項
これらの情報および投稿は、TradingViewが提供または承認する金融、投資、取引、またはその他の種類の助言もしくは推奨であることを意図したものではなく、またこれらに該当するものでもありません。詳細は利用規約をご覧ください。
免責事項
これらの情報および投稿は、TradingViewが提供または承認する金融、投資、取引、またはその他の種類の助言もしくは推奨であることを意図したものではなく、またこれらに該当するものでもありません。詳細は利用規約をご覧ください。