
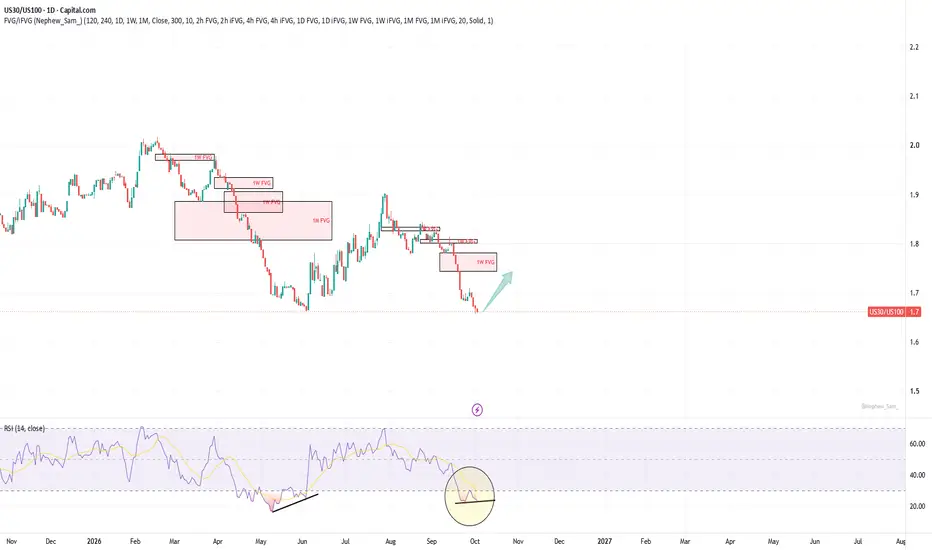
The daily positive divergence is not just on DJI and US30 charts but also on US30/US100 and DJI/NDX charts. This means if it will be confirmed Dow Jones may outperform nasdaq for some time.
ノート
There is also a developing weekly divergence on US30 divided by US100 chart. When Nasdaq underperforms Dow Jones indices usually decline. We might see a deep correction on all indices soon.注文をキャンセル
Daily divergence was invalidated today. Need to wait for a new one.ノート
Well, it worked anyway. Looks like RSI length = 7 works better for this chart.
免責事項
これらの情報および投稿は、TradingViewが提供または承認する金融、投資、取引、またはその他の種類の助言もしくは推奨であることを意図したものではなく、またこれらに該当するものでもありません。詳細は利用規約をご覧ください。
免責事項
これらの情報および投稿は、TradingViewが提供または承認する金融、投資、取引、またはその他の種類の助言もしくは推奨であることを意図したものではなく、またこれらに該当するものでもありません。詳細は利用規約をご覧ください。